July 10, 2026
XOM Reports July 31. The Q2 Windfall Is Already Priced In.
Featured: XOM Reports July 31. The Q2 Windfall Is Already Priced In.
Dear Reader,
Elon Musk himself has said SpaceX is NOT making a phone…
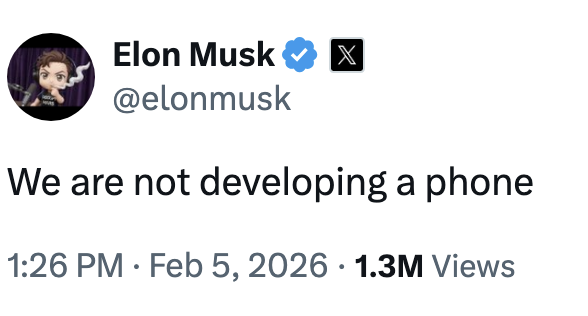
But I believe he’s being very sneaky…
Because according to recent SpaceX documents…
His plans for an “xPhone” may have just been revealed.
But NOT in the way you’d expect…
And because no one is expecting it…
Elon’s NEXT big move could make fast-movers a fortune.
Click here now to see what’s going on.
Tim Sykes
CEO, Millionaire Media LLC
FEATURED
XOM Reports July 31. The Q2 Windfall Is Already Priced In.
Here is something that does not happen often. A company signals a nearly $5 billion earnings boost from the prior quarter, and the stock is still trading roughly 20% below its highs from just a few months ago.
That is where ExxonMobil sits right now.
On July 7, ExxonMobil filed its standard 2Q 2026 Earnings Considerations 8-K. The numbers are significant. Higher liquids prices are expected to lift Q2 upstream results by $3.5 to $3.9 billion versus Q1. Refining timing effects add roughly $2.6 billion more. Partially offsetting those gains: approximately $1 billion in disruptions tied to the ongoing situation in the Middle East. Net it all out, and analysts are now projecting around $15.7 billion in adjusted earnings for the quarter, per LSEG consensus estimates. That is roughly triple Q1 GAAP earnings of $4.2 billion.
Some investors think Elon’s next move is hiding in plain sight
Most people dismissed the “xPhone” rumors immediately.
That’s probably why this setup caught my attention. According to recent SpaceX documents, Elon may be approaching the mobile market from a completely different angle than the crowd expects.
And fast movers are starting to notice.
So why is XOM trading near $140, well off its 52-week high of $176.41 hit in late March?
The answer is what happened after Q2 ended. Not during it.
The Geopolitical Premium That Came and Went and Came Back
Brent crude averaged $96.68 per barrel during the April through June quarter, up 23% from Q1, as the U.S.-Israeli conflict with Iran injected a massive risk premium into oil markets and the Strait of Hormuz, which carries roughly a fifth of global oil flows, was effectively shut down for months. Brent touched $120.88 intraday in late April before pulling back sharply as hostilities eased and a ceasefire took hold.
By early July, WTI had pulled back to the low $70s. Then Trump declared the ceasefire over, the U.S. launched fresh strikes on Iran, and oil surged more than 7% in a single session before giving back gains. As of this writing, WTI is hovering around $71 to $73, with traders reassessing how much disruption the renewed hostilities will actually cause at the Strait.
This is the core tension heading into July 31. Q2 is going to look exceptional. Q3 guidance is where analysts are clashing.
Goldman Sachs reaffirmed a Hold with a $157 price target after the July 7 filing, saying Q2 results look broadly in line with consensus. Citi moved in the opposite direction, cutting its target to $155 from $175 while keeping a Neutral rating. UBS issued a Buy. Barclays and Bernstein both reaffirmed Buy ratings. That is a wide range of opinion on a single stock heading into a known catalyst event, which tells you something about the genuine uncertainty baked into the forward picture.
Brief tangent worth noting: President Trump has specifically called out ExxonMobil and Chevron as part of a DOJ probe into gasoline prices. That political pressure puts XOM management in a delicate spot during the earnings call. Expect very careful language around forward production targets and pricing commentary. The call is scheduled for the morning of July 31, following results at approximately 5:30 a.m. CT.
The Numbers Behind the Quarter
ExxonMobil’s Q1 2026 baseline: adjusted EPS of $1.16 (excluding identified items), beating consensus of around $1.02 by roughly 13 to 15 percent. Revenue was $85.14 billion, up about 5% year over year. GAAP net income was $4.2 billion, weighed down by $3.9 billion in unfavorable mark-to-market timing effects on unsettled derivatives and $706 million in Middle East supply disruption losses. Those two items are expected to largely reverse in Q2 — which is a big part of why the Q2 number is expected to look so strong.
Wall Street consensus heading into Q2 is approximately $3.43 per share in adjusted EPS, with some estimates ranging as high as $3.75. Adjusted earnings consensus sits around $15.7 billion, per LSEG data.
“I’ve been tracking this one ticker for years. Right now, it’s the best setup I’ve ever seen.”
It has nothing to do with AI, tech, or precious metals. Most investors have never heard of it.
But every time the Fed has made a major move, this ticker has moved with it… and the profits have been extraordinary.
117% in under a month. 89% in seventeen days. 35% in two days.
Now Trump is triggering the biggest Fed shift in nearly 20 years.
Click here to get the name of this ticker – completely free.
The core problem for directional traders is the asymmetry between what is already known and what remains genuinely uncertain. Q2 beats expectations. That is probably not where the real opportunity lies. The question is whether the market reads forward guidance as the start of a new sustained earnings level, or as the peak of a one-quarter geopolitical windfall that will not repeat at the same magnitude.
What the Options Market Is Telling You
Despite the Q1 adjusted beat, the stock sold off pre-market on May 1 as broader market concerns outweighed the headline numbers. That pattern is worth keeping in mind heading into July 31. A strong Q2 number does not automatically translate into a higher stock price if the macro backdrop is deteriorating or if forward guidance disappoints.
With renewed US-Iran tensions actively moving oil prices and the FOMC meeting landing two days before XOM reports, implied volatility in near-dated XOM options should remain elevated through the event. The practical question for options traders is whether that elevated IV is rich enough to sell, or whether the genuine binary uncertainty around oil prices justifies owning premium into the event.
A covered call or cash-secured put framework, as IBD and others have noted for high-IV energy names around earnings, can let a trader generate income or acquire shares at a discount rather than taking a raw directional bet on a coin-flip event.
Structured Trade Framework
For traders expecting XOM to hold above $130 through earnings and consolidate afterward, a bull put spread, such as selling the August $135 put and buying the $125 put, is a defined-risk structure that collects premium while capping max loss. The logic: Q2 beats, buybacks continue ($4.9 billion in Q1 alone), and the $1.03 quarterly dividend provides institutional price support. ExxonMobil has also guided to $20 billion in full-year 2026 share repurchases, assuming stable market conditions.
For traders expecting Q3 guidance to disappoint, particularly on oil price assumptions or volume targets out of the Permian, a bear call spread above current levels targets the reaction to a forward guidance miss. ExxonMobil’s upstream earnings are directly and mechanically tied to crude realizations. If management guides to $75 to $80 Brent for the back half of 2026, the Q3 earnings path looks materially lower than Q2.
For traders who believe the Q2 numbers have already been fully absorbed by the market before July 31, a put spread targeting the $130 to $135 zone captures a guidance-driven pullback without unlimited exposure. Defined risk only.
Risk Analysis
Three things can break this trade in either direction. First, Middle East escalation: the ceasefire just collapsed as of this writing, with fresh U.S. strikes on Iran and retaliatory attacks on U.S. bases in the region. Any closure or meaningful disruption of the Strait of Hormuz could send oil sharply higher and flip the entire forward picture. Second, OPEC+ cohesion: further quota departures or production disputes could accelerate a supply excess and push prices lower even if geopolitical noise remains elevated. Third, the Fed. The Federal Open Market Committee meets July 28 to 29, just two days before XOM reports. Per CME FedWatch data, roughly 22% of the market is currently pricing a rate hike at that meeting, up from 12.5% a month ago. A hawkish surprise from Fed Chair Kevin Warsh could take the whole energy sector lower, regardless of what ExxonMobil actually reports. The Fed’s median year-end rate projection from the June meeting already shifted to 3.8%, signaling that at least one hike this year is on the table.
Forward Outlook
ExxonMobil’s Q2 earnings will almost certainly reflect an unusually strong quarter. The $96.68 average Brent price during April through June was 23% above Q1 levels. Refining timing effects that hurt Q1 should reverse cleanly. What is in dispute is whether the Q2 result is the beginning of a structurally higher earnings level, or whether it was a one-quarter confluence of geopolitical events, derivative reversals, and margin tailwinds that will not repeat.
The dividend, raised for 43 consecutive years and yielding around 3%, is the floor for patient holders. Permian production guidance and Guyana volume exit rates are the two operational metrics most worth watching when results hit. Management has previously guided to roughly 200,000 barrels per day of annual Permian growth, targeting an exit rate approaching 1.8 million barrels per day. A miss there makes the premium harder to defend at $140.
The options market, if it is pricing any of this correctly, should show elevated IV in near-term contracts through the July 31 event and a sharp drop-off in longer-dated vol once it resolves. Watch put and call flow in the week of July 21 for directional signals from institutional positioning. At this point, the market is not asking whether Q2 was good. It was. The market is asking what XOM is worth once the war premium fully unwinds.
The 7 Things I Wish I’d Known Sooner
I’ve been trading for over 50 years. In that time, I’ve made every mistake an options trader can make – and watched plenty of other people make them too.
Here’s what I learned: the losses you regret most almost never come from a lack of knowledge. They come from skipping a step you already knew to take.
So, I wrote down the 7 steps that matter most. On one page. Run it before any options trade.
It’s called the Smart Trade Options Checklist. Normally $29.97. Free today.
Tactical Checklist
- XOM Q2 earnings date: Thursday July 31, 2026, results at ~5:30 a.m. CT
- Q2 adjusted earnings consensus: ~$15.7B (LSEG); EPS consensus ~$3.43 per share
- Q2 profit signal drivers: $3.5B to $3.9B from higher liquids prices vs. Q1; ~$2.6B from refining timing reversal; ~$1B headwind from Middle East disruptions
- Brent Q2 average: $96.68/barrel, up 23% from Q1; peaked near $120.88 intraday in April
- Current WTI: ~$71 to $73 and volatile on renewed US-Iran hostilities as of July 9-10
- Q1 baseline: Adjusted EPS $1.16, revenue $85.14B, GAAP earnings $4.2B
- Analyst divergence: Goldman Hold ($157), Citi Neutral ($155), UBS Buy, Barclays Buy, Bernstein Buy
- Key macro event directly before earnings: FOMC meeting July 28 to 29; ~22% probability of rate hike per CME FedWatch
- Fed funds rate currently: 3.50% to 3.75%; June SEP median year-end projection shifted to 3.8%
- Geopolitical watch: US-Iran ceasefire collapsed; Strait of Hormuz disruption risk is live and active
- Defined-risk bull bias: Bull put spread if holding $130-plus support through event
- Defined-risk bear bias: Bear call spread or put spread targeting $130 to $135 if expecting guidance-driven pullback
- Monitor near-dated IV for expected move sizing ahead of the July 31 event
- Do not size this trade without accounting for FOMC event risk immediately prior