
July 2, 2026
Silver’s Sixth Deficit. The Market Still Hasn’t Processed It.
Six straight years of undersupply, and the hole is getting deeper, not smaller.
Trump Drops a Triple Bombshell
According to one ex-Wall Street insider, President Trump is preparing to unleash a stunning, triple-bombshell on Washington.
It’ll send shockwaves across America, the moment it goes live – triggering a $7.5 trillion chain reaction in the markets.
With one little-known corner of stocks erupting by up to 1,000% in 12-24 months.
This isn’t being covered on CNBC.
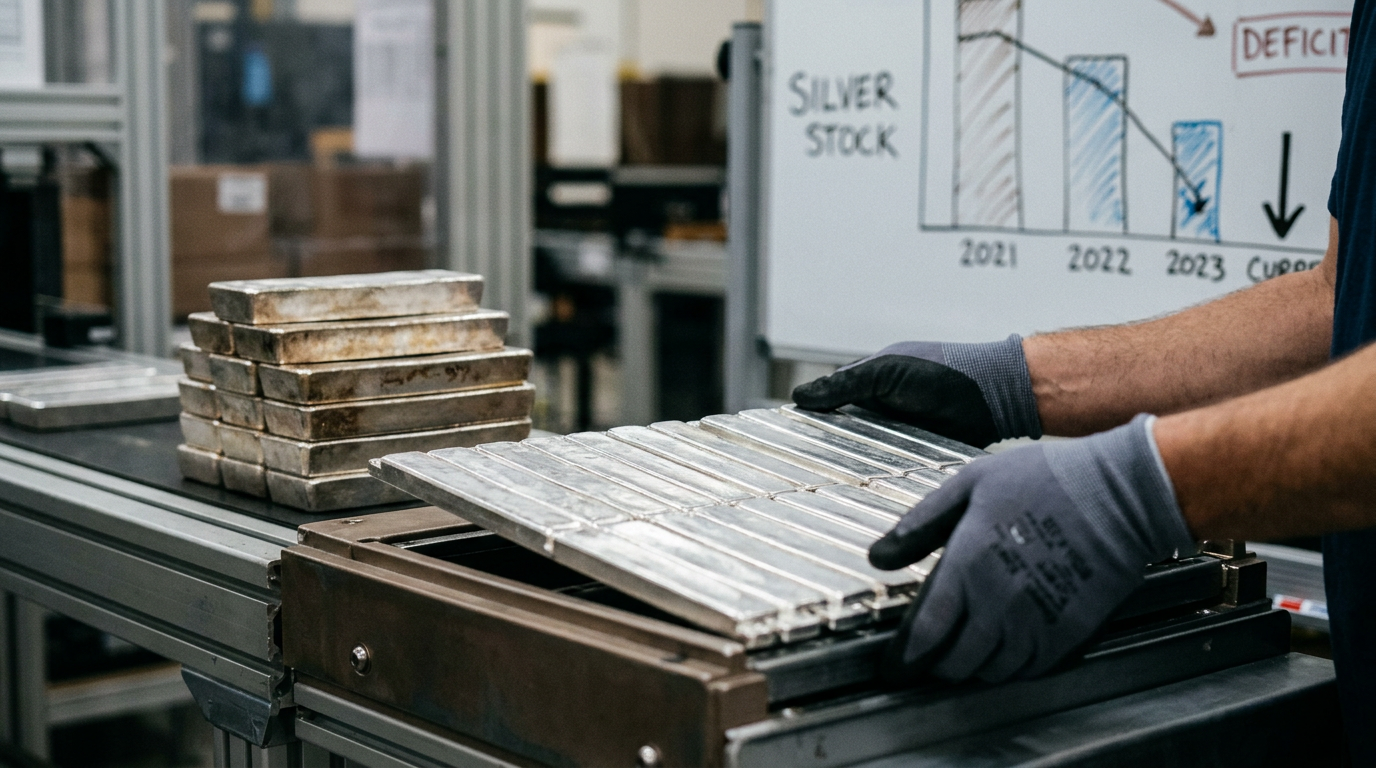
The Silver Institute’s World Silver Survey 2026 landed in April. The headline was straightforward: the silver market is heading into its sixth consecutive annual supply deficit, projected at 46.3 million ounces — widening from 40.3 million ounces in 2025. That’s a 15% increase in the shortfall, year over year.
Most investors skimmed it and moved on.
What’s interesting is the cumulative math. Since 2021, the silver market has drawn down 762 million troy ounces from above-ground stocks. Not in a single dramatic event. Slowly, steadily, year after year. COMEX registered silver inventories — the measure of metal actually available for futures delivery — have fallen roughly 75% since 2020. From approximately 346 million ounces to around 88 million.
That is not a cyclical number. That is structural depletion.
Here is the part most portfolios are not pricing. Mine supply is essentially inelastic. Most silver is extracted as a byproduct of copper, zinc, and lead operations. Production decisions are made based on base metal economics, not silver prices. When the market runs short, new mine supply takes five to ten years to respond. The structural constraint does not fix itself quickly.
At the same time, the demand composition is shifting. Industrial applications — solar panels, electric vehicles, AI data centers, high-speed transmission hardware — account for the large majority of silver demand, and that category is relatively price-insensitive. These industries need silver to function. They do not cut back because the price has moved higher. The expansion of AI data centers and automotive electronics continues to support silver consumption even as solar manufacturers actively reduce the silver intensity per panel.
On the investment side, coin and bar demand is expected to rise 18% in 2026, reaching its highest level since 2022. ETP holdings remain elevated. India has been a persistent source of physical buying, with investors showing a willingness to hold rather than sell into rallies — reinforcing tightness in the physical market.
This year has not been calm. Silver hit an all-time high above $121 in late January before crashing 38% in a single session after rate expectations shifted. As of late June, prices have stabilized in the mid-to-high $60s, caught between Middle East tensions and a stronger dollar. The gold-to-silver ratio sits at around 61:1 — still compressed from the 100:1 extreme hit in April 2025, but off the January lows.
The violent price action scared off some buyers. That may be exactly the wrong response to what the supply data is actually saying.
The structural case doesn’t require the price to move tomorrow. It requires the deficit to continue — which it has, every year since 2021, without exception. Available silver in London vaults fell to a historic low of 17% unencumbered in September 2025, triggering a physical liquidity squeeze that sent lease rates spiking. That was a warning shot. The underlying conditions that caused it have not been resolved.
Silver sits at the intersection of monetary metal demand, energy transition infrastructure, and technology manufacturing. That dual role creates volatility — but it also creates a floor that gold, in its purely monetary role, does not share. The deficit widens. The reserves shrink. The market keeps explaining it away.
At some point, the explanation runs out of runway.