No new bills, no new coins, no crypto, and no central bank digital currency…
Yet I believe President Trump could be about to trigger the biggest change to America’s money in more than 50 years.
Not since the Nixon administration struck its secret deal in the desert to create the petrodollar has America seen a monetary shift as radical as the one I believe Trump is plotting right now.
And it doesn’t matter who controls Congress, this plan was set in motion behind closed doors in Washington.. and it’s being carried out through a series of emergency declarations, international pacts and executive orders, including Executive Order 14241.
Once you understand Trump’s dollar reset, the seemingly chaotic events of the past few years suddenly click into place:
The obsession with Greenland and annexing Canada, the seizure of Venezuela’s oil, the war in Iran, and the government’s billion-dollar stakes in obscure mining companies.
In my view, they’re all part of a larger plan to build a new monetary order [revealed in full here].
If this unfolds as my research suggests, the dollars in your wallet will look exactly the same, and the balance in your bank account won’t move up or down overnight.
But this reset could trigger a widespread repricing of goods, services and assets across the United States.
So if you have savings, if you’ve been building up your retirement, or if you own a stock portfolio, I believe you need to understand what’s happening to America’s money soon.
Because on December 14, when Trump hosts world leaders at his Doral resort in Miami, I think he could unveil his new dollar to the world in all but name.
In my view, there’s an enormous opportunity here – because a specific band of assets connected to this reset have already begun to ignite, and I’d like to show you which ones could be next.
That’s why I’ve recorded this briefing to get you up to speed. Inside, I reveal the investments I believe you should consider today to get on the right side of Trump’s dollar reset – and the types of investments to avoid as this situation unfolds.

Good investing,
Porter Stansberry
Silver Has Lost More Than Half Its Value Since January
Silver is not just losing. It is losing both arguments at once.
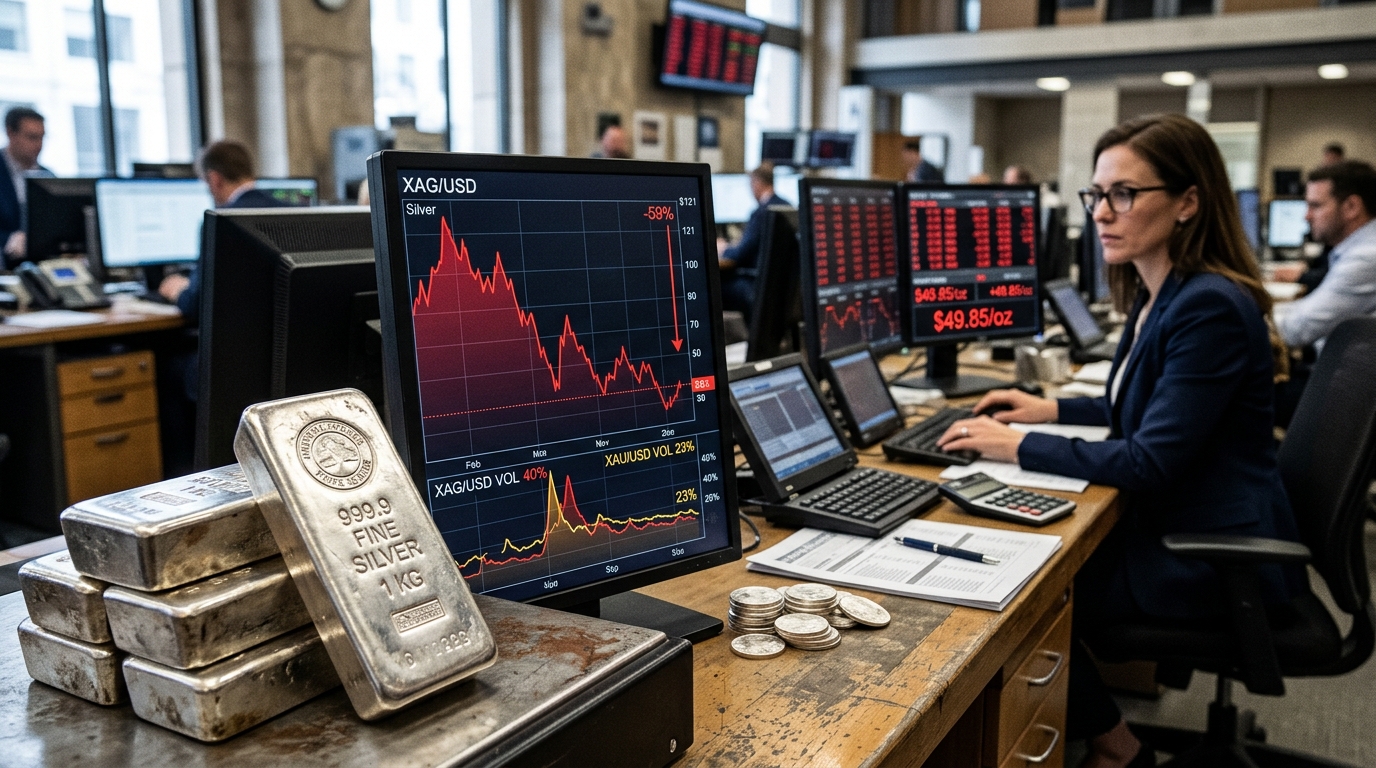
The metal that markets bid to a nominal all-time high of $121.67 on January 29, 2026, has fallen about 59% from that record and now trades around $50 per ounce. The industrial thesis that sustained the first leg of the bull run, anchored in solar demand, AI data-center infrastructure, and persistent supply deficits, has cracked under the weight of a slowing global manufacturing cycle. The monetary thesis, the safe-haven bid that carried gold to its late-January peak, has been dismantled by a rate cycle that refuses to pivot. At $50, silver cannot decide what it is, and the market is punishing that indecision.
Gold, for its part, sits near $3,894 on November 13. That represents a painful drawdown from the January peak, but the gold-to-silver ratio has reset sharply: where it ran near 45:1 at the January record highs, silver had massively outperformed gold to get there, and the reversal has been equally asymmetric. Silver’s roughly 59% collapse dwarfs gold’s pullback from its own peak, confirming the structural observation that silver magnifies both directions.
The Macro Driver
Inflation dipped slightly in October from September’s high reading but came in stronger than forecast, with CPI rising 0.4% for the month, above the 0.3% consensus. Core CPI also ran hot at 0.3%. The response in rates markets was immediate: Treasury yields climbed sharply, with the 10-year back near 5% and the 30-year around the mid-5% range. CME FedWatch probabilities also moved toward a December hike. A higher-for-longer rate path is the single most corrosive force for non-yielding commodities. Silver, which carries no coupon and demands storage costs, absorbs that force more directly than almost any other asset class.
What the Options Market Is Charging
This is where the analysis sharpens. The vol gap between SLV and GLD is not incidental; it reflects genuine uncertainty about where silver finds a floor.
Across commonly used options data feeds, SLV 30-day implied volatility has been running around 40% in early November, versus roughly 23% for GLD. Against that backdrop, GLD’s 30-day implied volatility sits at roughly 23%, in the lower part of its one-year range, with an IV rank near 19 out of 100. SLV’s IV running well above GLD’s means option buyers are being asked to pay a significant vol premium for silver exposure relative to gold. Silver swings far more than gold, so its options carry much higher implied volatility at a fraction of GLD’s share price.
The vol gap between SLV and GLD is not new to options traders who follow macro catalysts. Gold options have shown how implied volatility clusters around scheduled macro data releases rather than spot price moves.
The Cboe’s VXSLV, a 30-day reading built from options on the SLV fund, was around the mid-40s in early November. For traders sizing structures, that is the number that matters. The expected move for SLV is wide enough that undefined-risk positions carry real tail exposure in both directions.
Structured Trade Framework
Bull case: If you believe silver’s industrial demand thesis reasserts as the Fed signals a pause after December’s expected hike, a defined-risk long through a December or January call vertical on SLV caps premium outlay against the elevated IV environment. Targeting a reclaim of the $59-$63 zone, as flagged in forward scenario analysis, requires the macro headwind to ease materially.
Bear case: For traders expecting continued dollar strength and a 50-basis-point December hike, Fed Governor Christopher Waller has said a 50-basis-point move should be considered if core inflation remains around 0.3% or higher. A defined-risk put spread on SLV, with the short leg below the November 3 intraday low of $48.62, frames the downside without unlimited exposure. The downtrend remains intact below key moving average clusters, with the next meaningful support zone below $43.
Neutral case: With realized volatility elevated and implied near 40%, a short strangle or iron condor on SLV collects premium from elevated vol, with the risk that a macro shock outside the expected range creates significant assignment risk. This structure suits traders who believe the $48-$56 range holds into year-end but requires disciplined management on any break of either wing.
Risk Analysis
The primary risk to any bullish silver structure is the December FOMC decision. The Federal Reserve’s scheduled policy decision is December 9, 2026, after its two-day meeting on December 8-9. Traders have been pricing a quarter-point hike as the base case after the October CPI report. A surprise 50-basis-point move would likely extend the metals selloff and compress SLV below the November low. On the upside, any geopolitical shock or manufacturing rebound data from China could produce the kind of violent, short-covering rally that silver has demonstrated before. Silver fell more than 30% in roughly a day from its January high, then partially recovered; the same leverage that drove the collapse can reverse it without warning.
Action Checklist
- Monitor 10-year yield relative to 5.0%: a sustained move above that level adds pressure to silver and all non-yielding metals.
- Watch the December 9 FOMC decision for size: 25bp is priced, 50bp is not fully priced and would be the incremental shock.
- Size SLV positions to the expected move, not to the spot price. At roughly 40% IV, a 10% weekly move is within one standard deviation.
- Compare GLD versus SLV performance daily: if gold stabilizes while silver continues lower, the gold-silver ratio widening confirms continued industrial demand weakness, not just a monetary metals repricing.
- Defined-risk structures only. Silver’s realized volatility profile makes undefined-risk positions a capital threat, not a strategy.