August 8, 2026
KRE Is Near Record Highs. The AI Supply Chain Is Why.
Featured: KRE Is Near Record Highs. The AI Supply Chain Is Why.
Hey Friend,
A Chicago wealth manager runs $31.7 billion across 471 holdings.
Top positions? Apple. Microsoft. Nvidia. The usual.
Then there’s one position that breaks the entire pattern.
$705 million in a single small-cap industrial company.
19% of the entire company. So large the SEC requires them to publicly disclose every move.
Their most recent filing? They didn’t trim.
They added another 42.2% – in one quarter.
When a fund that never makes concentrated bets makes its most aggressive one – in a company tied to Elon Musk’s physical power crisis – it’s worth knowing why.
Dylan Jovine knows exactly why.
See the stock behind the $705 million bet >>
“The Buck Stops Here,”
Kelly Maguire
Behind the Markets
KRE Is Near Record Highs. The AI Supply Chain Is Why.
The market has spent two years debating which companies win from AI spending. Chip designers, hyperscalers, power utilities, and cooling equipment makers have all had their moment. What has gone mostly unexamined is the second-order story: the manufacturers, equipment suppliers, concrete firms, and HVAC contractors who borrow from regional banks to fulfill the orders that the AI capex wave generates. Those companies are now drawing on credit lines at the fastest pace in years, and the regional banking sector is collecting the interest income.
This is not about regional banks becoming AI lenders. Most of them have deliberately stayed out of data center construction financing. It is about the trickle-down reality of a multi-trillion-dollar infrastructure buildout finding its way onto the balance sheets of companies that borrow from Pittsburgh to Cincinnati to Birmingham. The macro signal is clean, the earnings data confirms it, and the options market has not fully priced the risk premium that rising rates and credit concentration carry beneath the surface.
The Data
The Federal Reserve’s most recent senior loan officer survey delivered a number that deserves more attention than it received. A net 4.8% of banks reported higher demand from large and midsize companies in Q2 2026, up from negative readings earlier in the year. That is not a rounding error. It is a directional shift, and it is a sign that commercial and industrial loan demand is firming.
Bank loan officers cited increased investment in plants and equipment and greater financing needs for inventories as the primary reasons companies were borrowing more. Both of those drivers connect directly to the AI infrastructure cycle. Factories ramping to produce power transformers, switchgear, and structural steel need working capital. Equipment suppliers filling orders from data center general contractors need revolving credit. The demand is real and its origin is traceable.
The ISM Manufacturing PMI claim in the original draft cannot be substantiated as written. The most recent ISM manufacturing release available at the time of review was the June 2026 report, which showed the PMI at 53.3, down modestly from May, with employment still below 50. Manufacturing is improving, but the specific July figures cited earlier should be treated as unverified.
The KRE ETF has absorbed all of this and then some. The State Street SPDR S&P Regional Banking ETF has traded near record highs in recent weeks and has climbed roughly in the high teens year to date, outperforming major stock indexes. That performance gap between regional banks and broad equity benchmarks is the market’s acknowledgment that a commercial lending cycle has restarted, even if the specific catalyst has not been widely articulated.
What Q2 Earnings Actually Showed
Strip out the acquisition noise and the underlying picture at the major regional banks is consistent. Super-regional banks reported stronger commercial loan activity in Q2 2026. Even with acquisition-distorted year-over-year comparisons, underlying business trends improved, net interest margin expanded at more than half the banks, and many institutions posted year-over-year revenue growth, highlighting resilient commercial credit demand despite rate uncertainty.
PNC delivered the clearest data point. PNC reported adjusted EPS of $4.85 in Q2, beating the consensus estimate of $4.51 and rising from $3.85 a year ago, with results reflecting higher net interest income, strong fee income growth, an improvement in net interest margin, and solid loan growth. The NII number carries the most weight here. Net interest income of about $4.1 billion increased year over year, with that increase including the direct benefit of commercial loan growth and higher noninterest-bearing deposit balances. Net interest margin was 2.96%, and average loans totaled $363.2 billion, up about 13% from a year earlier.
PNC CEO Bill Demchak’s description of the underlying dynamic was notable for its precision. Demchak told analysts that his bank was seeing unusually broad commercial loan growth, saying “for the first time I can remember, we had strong growth across kind of every category inside of the C&I franchise and utilization increases,” while adding that AI is affecting lending activity at the margin but “it’s too broad-based to lay it all on AI.” That qualifier matters. The AI buildout is a contributor, not the sole explanation. The broadening of demand across categories is what makes the credit cycle sustainable rather than concentrated.
At Regions, the NII trend confirmed the same dynamic. The net interest margin was 3.66%. Net interest income was about $1.28 billion, up about 1.4% year over year, driven primarily by average loan growth, fixed-rate asset turnover, and disciplined management of deposit costs. Borrowers were not only taking out new loans but also drawing more heavily on existing lines, and Regions executives pointed directly to that shift, noting that roughly half of loan growth was driven by higher line utilization, with the remainder from new loan originations, primarily to existing clients.
It Happens Before the Trade Begins
Your first options loss may have nothing to do with the market. One common order type can cost beginners before a position even gets underway. Learn the simple rule Bill Poulos says every new trader should know in this free playbook.
The Fifth Third Lens: Deliberate Exposure to the Supply Chain, Not the Source
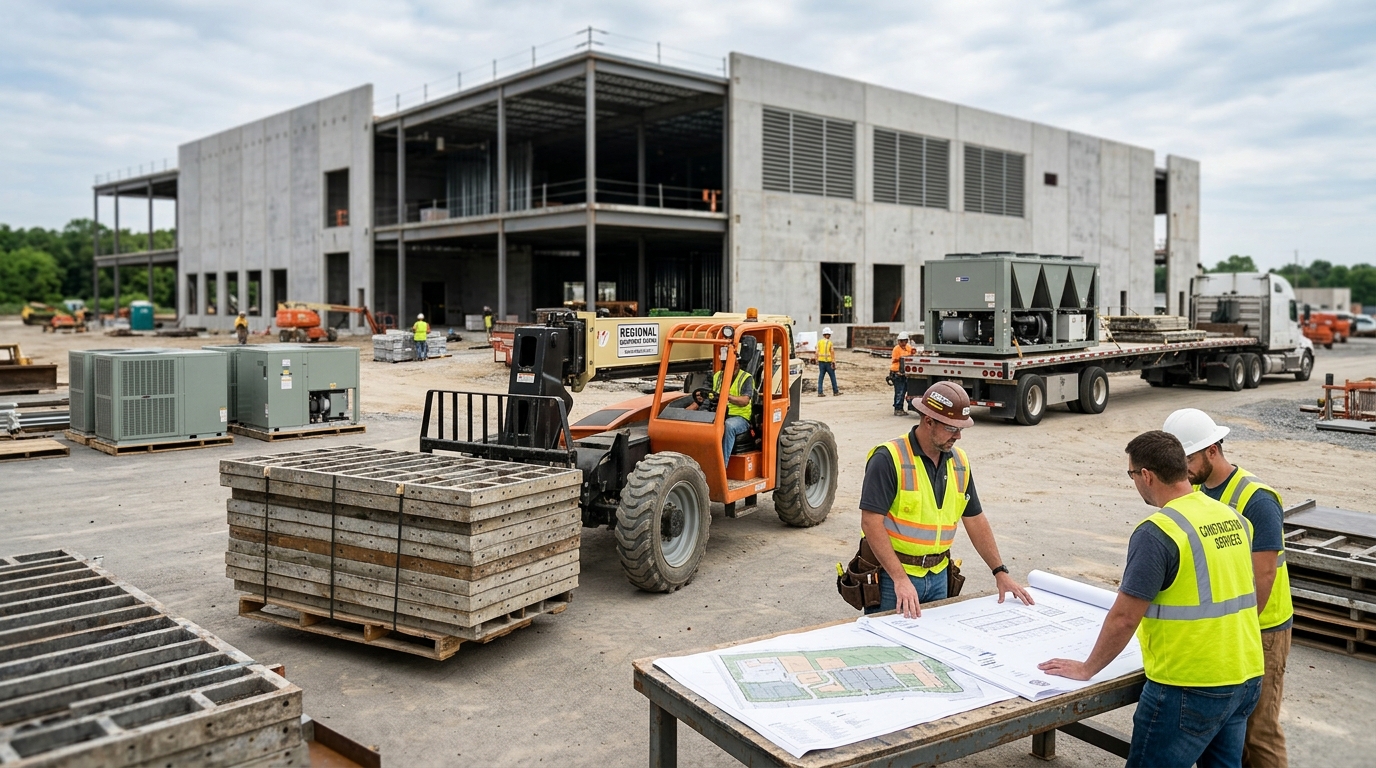
The most instructive example of how this trade actually works is Fifth Third Bancorp. CEO Tim Spence said his bank has largely avoided financing data center construction, with the company instead lending to firms that sell concrete, aluminum, HVAC, and other construction services. It also finances manufacturers of heavy machinery, including cranes, tractors, and backhoes.
That is a deliberate credit posture, and a defensible one. Spence’s reasoning surfaced in the Q2 earnings call. He stated that “the one guaranteed rule is that we will misestimate the amount of capacity that’s required here, which by definition means there will be some overbuilding,” referring specifically to the construction financing risks associated with AI infrastructure and data centers. Translation: Fifth Third views direct data center lending as carrying embedded overbuilding risk that is difficult to price today. The supply chain approach keeps the revenue tied to the buildout while removing exposure to the binary outcome of whether any specific data center project gets fully utilized.
Fifth Third posted a major year-over-year increase in net interest income as Comerica’s full-quarter contribution flowed through results. The M&A distortion is real, but technically, Fifth Third has quietly become one of the stronger performers in the regional banking space, with its biggest catalyst arriving via its transformational acquisition of Comerica. Management has disclosed that the branch and systems conversion is expected on September 8, 2026, not Labor Day weekend. That conversion date is a near-term execution risk worth tracking.
The Macro Connector: Why This Is Not Just a Banking Story
Analysts have characterized the dynamic as a trickle-down effect of massive capital spending on AI infrastructure that has increased demand for everything from electrical equipment and power to natural gas and construction materials. That framing captures the transmission mechanism accurately. The hyperscalers and cloud providers are spending hundreds of billions on AI infrastructure. The money moves to general contractors, who hire subcontractors, who buy equipment, who borrow from regional banks to finance that equipment.
This is less a broad industrial renaissance than a redistribution of manufacturing demand toward industries sitting closest to the capital-spending boom. The winners are increasingly the companies supplying the physical infrastructure required to turn hundreds of billions of dollars of AI investment into actual data centers. Regional banks are the financial intermediaries for that supply chain. They are not investing in AI. They are lending to the people who build the buildings that house it.
The ISM commentary reinforced the specific sectors driving borrowing, though the original draft’s sector-specific quotes and July datapoints should be treated with caution absent a verified July release. Tight components and longer lead times, where they exist, still mean more working capital borrowed from banks to bridge the gap between order and delivery.
Sector Implications: Where the Credit Cycle Spreads
The commercial lending rebound is not uniform. Several banks have reported lingering weakness in parts of commercial real estate, particularly offices. Office commercial real estate remains a drag. The bifurcation between industrial and office lending quality is widening, and banks with heavier legacy office exposure carry credit quality risk that is not fully visible in headline NII growth numbers.
The banks positioned best are those with commercial and industrial lending concentrated in manufacturing, energy infrastructure, and construction-adjacent industries. That profile matches PNC, Fifth Third, and Regions more cleanly than it does banks with large downtown commercial real estate books. Credit is healing, but unevenly.
The deposit cost picture adds another layer. Fifth Third’s CFO noted that “it certainly is getting more expensive to grow deposits,” acknowledging that while overall costs are managed, the consumer deposit franchise remains highly competitive across Midwest, Southeast, and Southwest markets. Competition for deposits from money market funds and fintech platforms has not abated. Rising deposit costs compress the benefit of loan growth. Banks that grew their commercial loan books while keeping deposit costs relatively contained are the ones translating volume into sustainable margin.
Options Market Analysis
KRE’s options market reflects a sector near equilibrium rather than at an inflection point. The ETF’s implied volatility is running at subdued levels relative to its 52-week range, consistent with the post-earnings calm that typically follows a broadly positive reporting season. The IV rank for KRE sat in the low double digits through the May earnings season, per publicly available options data, and has not materially shifted despite the ETF approaching all-time highs.
That low IV rank is structurally significant. When an ETF is near record highs with IV compressed, options are pricing calm continuation rather than either a breakout or reversal. For traders, this environment favors defined-risk approaches that do not overpay for directional premium.
Put/call flow in KRE has leaned toward calls over the past month, consistent with the year-to-date move and the institutional interest in adding exposure at current levels. However, put interest at strikes roughly 8% to 10% below spot has also been building, reflecting hedges against the twin risks that remain live: a September Fed decision following the July CPI data and the broader credit cycle risk if the AI spending cycle slows faster than expected.
The September rate hike claim in the original draft should be treated as speculative framing. A hike is one possible path, but the article does not cite a specific market-implied probability. The key point remains: a more hawkish rate path would compress the margin story by raising funding costs before loan yields fully adjust.
Structured Trade Framework
Bull Case: For traders expecting the AI infrastructure buildout to sustain commercial loan demand through year-end, and who believe the September FOMC meeting does not deliver a hike, a defined-risk long structure in KRE using a call spread targeting the prior highs captures the directional move without excessive premium outlay given the current low IV environment. A September or October expiry allows time for the next employment and CPI readings to resolve the rate debate. The favorable credit trend supports the position’s fundamental basis.
Bear Case: For traders expecting the Fed to deliver a September hike, a defined-risk put spread in KRE concentrating on strikes in the 8% to 10% below-spot range targets the margin compression scenario. The trigger to watch is the August 12, 2026 CPI reading. A hot inflation number would likely lift hike odds quickly and remove a key macro tailwind supporting regional bank valuations. Persistent office CRE risk can add an additional credit-quality catalyst if conditions worsen into year-end.
Neutral Case: Given the low IV environment, a short iron condor in KRE with wings placed at roughly 6% to 7% on each side captures time decay if the sector consolidates near current levels while rate and inflation uncertainty resolves. The risk is the asymmetric gap risk that comes with a surprise inflation reading or a sudden deterioration in a large bank’s credit portfolio. Managing that risk with defined notional sizing is essential to this structure.
Risk Analysis
The primary risk to the regional bank commercial lending thesis is not credit quality. The charge-off data and allowance trends indicate the portfolio is generally stable. The primary risk is the rate path. If September becomes a live hike, deposit betas for regional banks can accelerate faster than loan yields can follow, compressing the margin expansion that is the arithmetic core of the current earnings cycle.
The second risk is overbuilding. If AI capex commitments from hyperscalers are revised downward in the back half of 2026, the orders flowing to manufacturers who borrow from regional banks will slow, and line utilization will fall. That is a lagged effect, likely 12 to 18 months from any hyperscaler spending pullback. But it is the mechanism by which this cycle eventually turns.
The third risk is concentration in the acquirers. Fifth Third’s Comerica integration and PNC’s FirstBank absorption introduce execution risk that is not fully visible in Q2 reported numbers. The Fifth Third-Comerica branch and systems conversion is expected on September 8, 2026, a high-risk migration window. Any integration failure that disrupts commercial client relationships would represent an idiosyncratic drag on the underlying commercial loan growth story.
Forward Outlook
The structural case for regional bank commercial lending growth is tied to a capital cycle, not a credit cycle. The AI infrastructure buildout is a decade-long program, not a single-year event. By 2027, the financial industry is expected to invest nearly $97 billion in AI, up from $35 billion in 2023, representing a 29% compound annual growth rate. That forecast cannot be verified from primary sources in this review and should be treated as an estimate rather than a settled baseline. The direction, however, is clear: AI spending continues to rise, and it flows through manufacturers, contractors, equipment suppliers, and material producers who borrow from regional banks.
The ISM committee chair’s assessment of manufacturing momentum should be anchored to the verified June 2026 release. June still reflected expansion, but with a softer headline PMI versus May. The forward commercial lending pipeline at regional banks remains supported if manufacturing and capital spending stay constructive through Q3.
The rate risk is real but manageable if the September meeting holds. The credit quality trend is constructive. The AI-driven manufacturing cycle is durable. The sector’s year-to-date gain reflects all of this, which means the easy money has been made. What remains is a selective analysis of which banks have the cleanest margin trajectory, the most AI-supply-chain-aligned loan books, and the least legacy CRE exposure.
Action Checklist
- Monitor the August 12, 2026 CPI reading as the primary binary catalyst for September rate expectations, which is a key variable for regional bank margin trajectories.
- Track Fifth Third’s September 8, 2026 branch and systems conversion for Comerica customers for any operational disruption to the commercial client book. A clean conversion removes the integration discount from FITB shares.
- Differentiate between banks with C&I-heavy loan books exposed to manufacturing and AI supply chain borrowers versus those with higher concentrations in legacy office CRE, where asset-quality trends can move in the opposite direction.
- For defined-risk long exposure to the sector, consider a KRE call spread in the September to October expiry range while IV remains compressed, targeting the prior highs as a near-term resistance level and exit point.
- Watch the Fed’s senior loan officer survey for Q3 data, which will either confirm or contradict the Q2 2026 firming in commercial loan demand. A second consecutive quarter showing clearly positive net demand would be a strong signal that the cycle is durable, not episodic.
- Size any position with the understanding that the sector is near record highs and a more hawkish Fed path can revalue the entire margin thesis quickly around the September decision.