August 23, 2026
Nvidia’s Q2 Earnings: The $93B Test
The AI trade is back. Now Nvidia has to prove the math still works at $93 billion a quarter.
First a note from Profits Run
The download link for my Simple Options Trading For Beginners book is about to expire.
Once it goes, the book goes back to $29.97 on the website – same book, same content, just no longer free.
This is one of those things where the people who grab it in the next sixty seconds will have it on their computer forever. The people who don’t will be staring at an order page tomorrow, wishing they’d taken the twenty seconds.
It’s a quick read that finally explains options in plain English. No Greeks. No textbook charts. Just the actual mechanics with step-by-step trade examples.
Grab the free copy before the link expires.
Good Trading,
Bill Poulos
p.s. This link will expire without warning.
The Question Is Not Whether Nvidia Beats. It Never Was.
Markets do not need a revenue beat from Nvidia. They have gotten seventeen of them in a row. What they need is a reason to believe the growth rate is defensible at a scale that, two years ago, would have seemed like science fiction.
Nvidia reports Q2 fiscal year 2027 results after the close on August 26, 2026. The stock is trading near $225, roughly 8.5% off the May highs. Implied volatility has climbed ahead of the report. And Wall Street, for the seventh consecutive quarter, is writing a number on the board that any other semiconductor company would frame and hang on the wall.
The consensus revenue estimate is $93.63 billion. EPS is expected at $2.13 on an adjusted basis. This is not a company trying to grow into its valuation. This is a company that produced $81.6 billion last quarter and has been asked to do it again, bigger, three months later. The question for traders and serious investors is not whether Nvidia clears the bar. It is whether the bar keeps moving in the right direction, and what happens to the stock if it does not.
What Wall Street Is Pricing In
Here is the consensus picture going into August 26, sourced from across the analyst community as of the week of the report.
- Revenue: $93.63B consensus vs. $91B company guide (±2%). Prior quarter Q1 FY27 came in at $81.6B, beating estimates by 3.16%.
- Adjusted EPS: Consensus range of $2.09–$2.13. Prior quarter delivered $1.87, beating the $1.77 estimate.
- Non-GAAP Gross Margin: Expected at approximately 75.0% (±50 bps), flat with the prior quarter’s 75.0%.
- Data Center Revenue: Estimated $85–87B for Q2, against $75.2B in Q1 FY27, which grew 92% year over year.
- China Revenue: Zero assumed in guidance. H20 chips remain restricted; the guide excludes all Data Center compute revenue from China.
- Year-over-Year Revenue Growth: Estimates range from 67% to 100% depending on the model. Q1 FY27 came in at +85%.
Nvidia’s own Q2 guidance was $91 billion, plus or minus 2%, with gross margins expected at 74.9% GAAP and 75.0% non-GAAP. Critically, that guidance assumes zero Data Center compute revenue from China, the same conservative posture the company took in Q1. Any H200 shipments that cleared export licensing during the quarter would represent pure upside against the guided number.
For context on the trajectory: Q1 FY2027 data center revenue of $75.2 billion grew 92% year over year. Non-GAAP EPS of $1.87 expanded 140% from the prior year. The company returned $20 billion to shareholders in a single quarter through buybacks and dividends and authorized an additional $80 billion repurchase program. These are not the numbers of a company in deceleration. They are the numbers of a company operating in a demand environment its own executives have described as constrained by supply, not demand.
Will You Survive the MAR-A-LAGO RESET?
Bloomberg calls it “a dire shift of fortunes for America” and The Wall Street Journal calls it a “New World Order.” Now, Dr. David Eifrig – a 40-year market veteran who traded through Black Monday and has recommended more than a dozen triple-digit winners – warns that you must make one of the most important financial decisions of your lifetime today.
He strongly recommends this ONE step to potentially secure your retirement.
Beat vs. Guide, and Why the Market Has Changed
This is not about whether Nvidia beats $93 billion. It is about whether the Q3 guide clears $100 billion and whether management can say, with conviction, that gross margins are not going to compress on the Vera Rubin transition.
Benzinga’s data spanning the last seventeen quarterly reports tells the story plainly: Nvidia has produced a 100% revenue beat rate and an 88% EPS beat rate, yet the one-day post-earnings reaction has averaged only a 2.4% gain with a median of essentially zero. The seven-day window has produced a negative median return of 3.5%, with ten of seventeen post-earnings weeks closing in the red. The market, in other words, is no longer paying for the beat. It is paying for the guide.
The four most recent quarters reinforce this. When Nvidia reported Q2 FY2026 results in August 2025, the stock closed slightly lower despite strong performance. Q3 FY2026 results in November saw an initial bounce that reversed into a 3% decline. Q4 FY2026 results in February 2026 sent the stock down roughly 5%. After Q1 FY2027 in May 2026, shares fell again. Four consecutive post-earnings drops from a company that has beaten estimates in every one of those reports. The pattern is not a mystery: elevated expectations baked in before the report leave little room for upside surprise, and any guidance language that falls short of perfection gets sold.
Goldman Sachs analyst James Schneider, writing ahead of the August report, identified four specific variables the market will scrutinize on the call: the status of Nvidia’s $500 billion AI financing plan with partners, the ramp timeline for the Vera Rubin platform, gross margin durability amid rising input costs, and early evidence of CPU revenue contribution from agentic AI deployments. Revenue is almost an afterthought. The forward architecture and the margin line are what move the stock now.
Sector Implications: $725 Billion of Demand Confirmation
Nvidia does not operate in a vacuum. Its demand signal comes from the capital budgets of its largest customers, and those budgets in 2026 are unlike anything the technology industry has produced.
The four largest hyperscalers, Amazon, Alphabet, Microsoft, and Meta, have collectively guided to approximately $725 billion in combined capital expenditures for 2026, up 77% from the $410 billion record set in 2025. Amazon alone projects $200 billion in capex for the year. Alphabet raised its ceiling to $205 billion at Q2 2026 earnings. Meta has raised guidance twice. Microsoft is tracking toward $190 billion. Goldman Sachs expects combined hyperscaler capex to reach $5.3 trillion between fiscal year 2025 and fiscal year 2030.
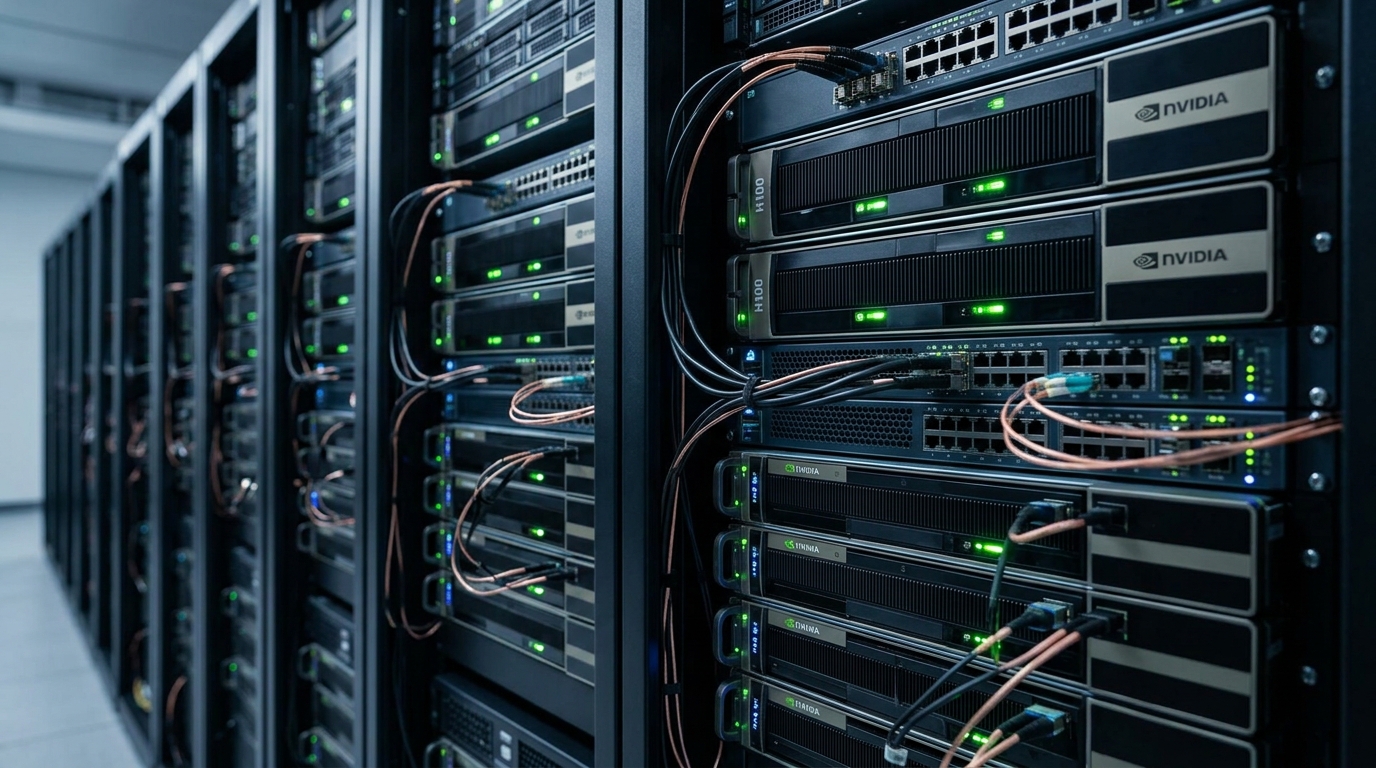
Most of this spending flows directly into the compute layer. Nvidia GPUs, custom silicon, data center construction, power infrastructure, and networking absorb the bulk of those budgets. At the Q1 earnings call, hyperscaler commentary was universally bullish: all players except Microsoft raised their 2026 spending guidance. Jensen Huang has cited $1 trillion in committed orders through 2027. That is not an aspiration. It is a signed order book.
The competitive pressure is real but overstated in the near term. Custom ASIC shipments from hyperscalers are projected to grow 44.6% in 2026, compared to 16.1% for merchant GPUs, per TrendForce. Hyperscaler-designed chips from Google, AWS, and Microsoft are expected to capture 15–25% of the total AI accelerator market, primarily for internal inference workloads. AMD’s Instinct line holds an estimated 5–7% of the market. Nvidia retains approximately 80% by revenue, and its CUDA software ecosystem, with more than 5 million active developers, creates switching costs that hardware benchmarks alone cannot capture. The moat is wide. What investors should watch is how narrow it gets at the margin, not whether it disappears.
Options Market Analysis
The options market is pricing this event with a moderate hand, not a fearful one. That distinction matters for structuring positions around the report.
- 30-Day Implied Volatility (IV): approximately 40.45%
- 30-Day Historical (Realized) Volatility: approximately 38.48%
- IV Rank (1-year range): approximately 36, placing current IV in the moderate third of Nvidia’s own one-year range
- Historical Average Earnings Move: ±8.3% across all reports; ±5.4% in more recent periods
- Historical Beat Rate vs. Implied Move: approximately 25%, meaning the stock clears its implied earnings move roughly once every four reports
- 52-Week Price Range: $164.07 to $236.54
An IV Rank near 36 means current implied volatility sits in the moderate third of Nvidia’s own one-year range. It is elevated versus realized movement, but not extreme. The gap between IV at 40.45% and realized volatility at 38.48% is narrow. This combination points toward a specific structural conclusion: the options market is not expressing fear, but it is pricing enough uncertainty to make premium selling uncomfortable without a defined-risk wrapper.
The historical implied-move data underscores why long straddles ahead of Nvidia earnings have been persistently difficult. The stock clears its implied move only about 25% of the time across the last sixteen reports. IV rushes hard into the event and collapses immediately after, the classic IV crush pattern. Holding long options through the report requires the actual move to exceed what the market has already priced in. Over time, the math has worked against long volatility players in NVDA specifically, even as the company continues beating estimates.
Put/call flow in the weeks before the August report has leaned call-heavy, consistent with the broader resurgence in the AI trade through July. However, institutional hedges via near-dated puts are visible in the chain, particularly at strikes near the 8–10% downside zone. This is typical pre-earnings positioning: participants are not bearish, but they are not ignoring the post-earnings pattern of the last four quarters either.
Structured Trade Framework
Three scenarios. Three structures. No position is appropriate for every account or risk tolerance. These are analytical frameworks, not instructions.
Bull Case: Beat, Raise, and Margin Hold
Thesis: Nvidia reports Q2 revenue above $93 billion, guides Q3 to $100 billion or above, holds non-GAAP gross margins at or near 75%, and delivers positive commentary on Vera Rubin’s Q3 ramp and any incremental China optionality from H200 export approvals. Analyst price targets clustering between $275 and $325, with the 68-analyst consensus at $303, imply 34% upside from current levels.
Defined-risk structure for traders expecting this outcome: A bull call spread, buying a near-the-money call and selling a higher-strike call at the September or October expiration, limits premium outlay while capturing directional exposure. Avoid naked long calls given the IV Rank at 36 and the historical pattern of IV crush post-earnings. For traders with a longer horizon, if you believe Vera Rubin’s Q3 ramp provides a multi-quarter re-rating catalyst, a December or January call spread allows time for that thesis to develop without the earnings event risk concentrated into a single night.
Bear Case: Margin Slip or Guidance Disappointment
Thesis: Nvidia beats Q2 revenue but guides Q3 conservatively, or gross margin guidance slips below 74% on rising DRAM, wafer, advanced packaging, and substrate costs during the Vera Rubin production ramp. The stock has dropped after each of the last four earnings releases. A fifth consecutive post-earnings decline would not be a statistical outlier. Any language about extended testing cycles, supply chain friction in Vera Rubin ramp, or deteriorating margin visibility would amplify the sell reaction given how much good news the stock has already priced in.
Defined-risk structure for traders expecting this outcome: A bear put spread, buying a put near current market and selling a lower-strike put, provides defined downside exposure with capped premium. Outright long puts face the same IV-crush headwind. A spread containing the risk on both sides is preferable. Target strikes based on the historical 8.3% average earnings move, which implies a downside zone near $205–$208 from current levels near $225.
Neutral Case: Strong Results, Muted Reaction
Thesis: Nvidia delivers another beat-and-raise, the stock moves within the implied range of ±5–8%, and the market digests the report without a durable directional breakout in either direction. This is historically the most common outcome. NVDA has cleared its implied earnings move only about 25% of the time across the last sixteen reports. An iron condor, selling both an out-of-the-money call and an out-of-the-money put while buying further out-of-the-money wings for protection, collects premium if the stock stays within a defined range. The structure benefits from IV crush regardless of direction. Maximum profit is collected if the stock closes between the short strikes at expiration. Defined risk is capped by the long wings.
For traders with no directional bias who believe the elevated IV relative to realized volatility creates a selling opportunity, the neutral structure captures the statistical edge. The risk is the tail event: a guidance shock in either direction that sends the stock past the short strikes and into the defined-loss zone. Position sizing accordingly.
Risk Analysis
The risks here are structural, not speculative. They are real enough to have materialized in prior quarters and specific enough to watch for in the August 26 call transcript.
- Gross margin compression on the Vera Rubin transition. Rising costs for DRAM, wafers, advanced packaging, and substrates are applying real pressure. Whether management maintains its fiscal 2027 gross margin guidance in the mid-70% range, and specifically the wording around cost trajectory, could move the stock more than the revenue number. A 75% gross margin while excluding an entire country (China) from the guide already signals pricing power. Any deviation from that floor is a significant data point.
- China as risk and optionality simultaneously. Nvidia’s Q2 guide assumes zero Data Center compute revenue from China. H200 licenses have reportedly been approved but generated no revenue in Q1. Any thaw in export restrictions represents unguided upside. Any tightening represents a headwind that is already excluded from numbers, meaning the downside surprise would come from a sequential worsening, not from a static exclusion.
- Post-earnings pattern risk. Four consecutive post-earnings stock declines despite beat-and-raise performance is not a coincidence. Elevated expectations create a high-water mark that is increasingly difficult to clear on the first day. Traders holding positions through the report should size accordingly and not assume a revenue beat guarantees a positive reaction.
- Custom silicon erosion at inference workloads. Hyperscaler-designed ASICs from Google, AWS, Microsoft, and Meta are explicitly targeting inference efficiency, where Nvidia’s share is already lower (estimated 60–75% versus 90%+ in training). This is a multi-year structural dynamic, not a Q2 binary event, but management commentary on agentic AI adoption and CPU revenue from the Vera platform will be parsed for signals.
- Vera Rubin margin dynamics during ramp. New platform launches historically compress gross margins temporarily before scale-driven cost reductions take hold. Blackwell followed this pattern. Rubin is expected to command higher rack-level pricing, but the Q3 ramp phase may produce a transient margin dip. Watch for how management characterizes the fiscal 2027 full-year margin outlook.
One setup. One 15-minute window. Done by 10 AM.
It’s called the “Opening Bell Breakout” – the same strategy behind moves like 113% on GOOGL and 240% on META. I put the full setup into a short, free guide you can start using tomorrow morning.
Forward Outlook
The Vera Rubin platform is in full mass production. CEO Jensen Huang confirmed initial shipments to OpenAI, Anthropic, and SpaceX in Q3 2026, with volume ramping in Q4. CFO Colette Kress was explicit at the BofA conference in June: