September 19, 2026
Bonus Content: Costco Options Are Pricing a Move 2.5x Bigger Than Normal
Attention active traders,
If you’ve been searching for high-probability income trades…
Or found what looked like one…
Only to walk away frustrated with the results…
It’s worth taking a look at this resource.
It covers an under-discussed 1-hour trading approach — available to access at no cost.
Complimentary access is available for a limited window.
To better trading,
– Drew Day
Partner
Base Camp Trading
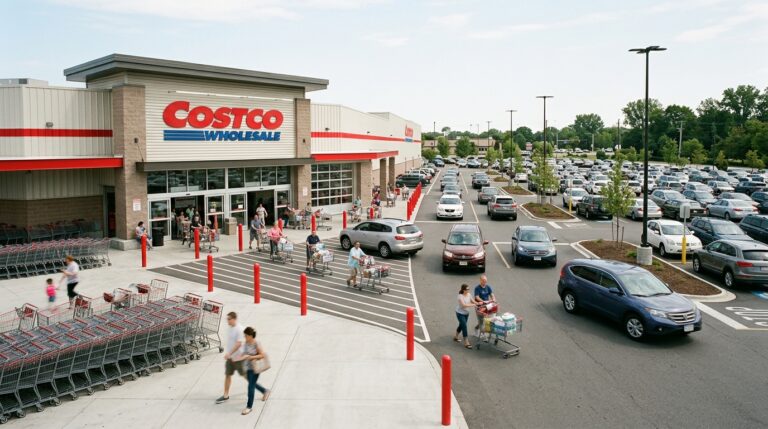
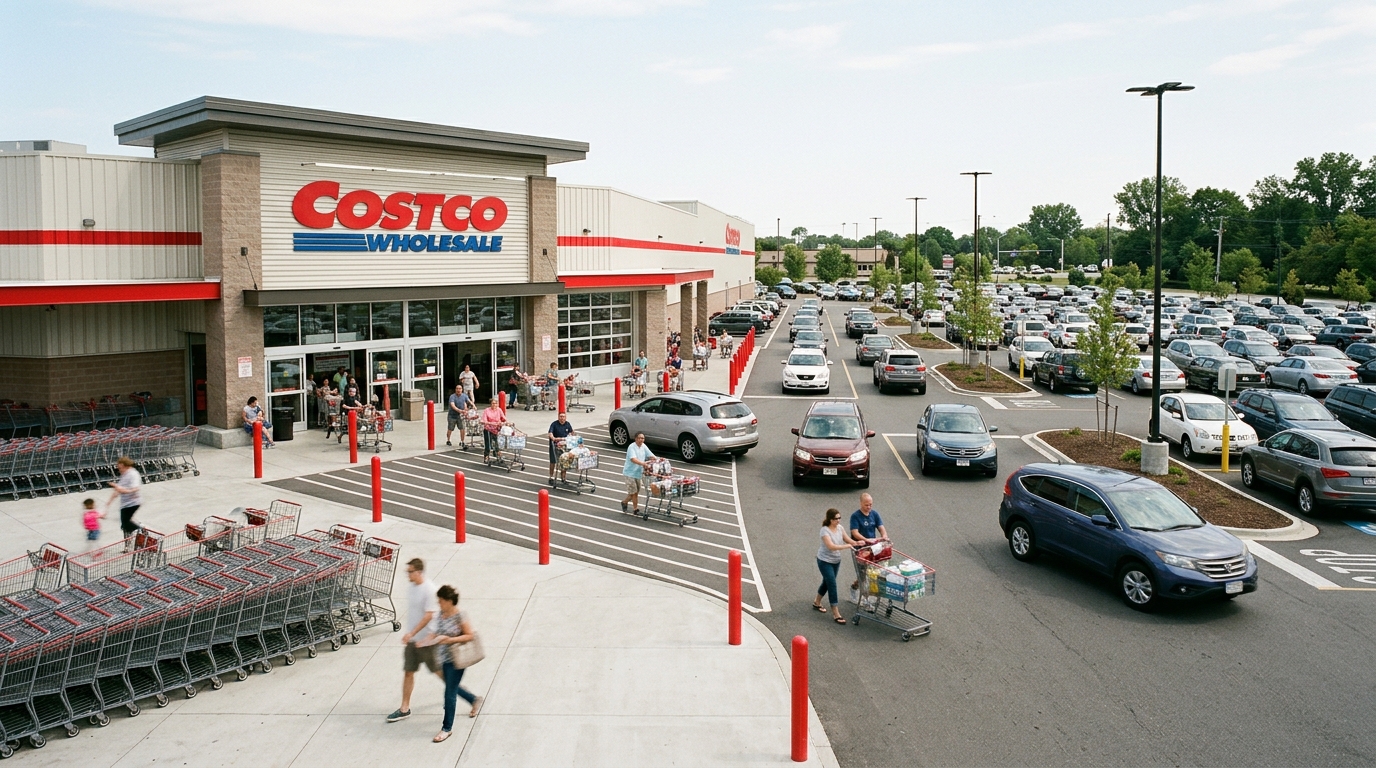
Costco Options Are Pricing a Move 2.5x Bigger Than Normal
Markets do not need Costco to be a great company. They need Costco to be a great company relative to what was already priced in. That distinction matters enormously this week, because the options market is charging a premium that history says it almost never earns back.
Options expiring September 24 imply a 3.53% move, or roughly $31.60 per share in either direction, against an eight-quarter average actual post-earnings move of just 1.42%. That gap is the trade. Before positioning around it, the math that drives either side deserves a hard look.
What the Desk Expects
Wall Street expects Costco to report revenue of $94.85 billion, up 10% from $86.16 billion a year ago, with adjusted EPS forecast to rise 12% year-over-year to $6.55, from $5.87. Bank of America models Q4 adjusted EPS at $6.52, just under consensus, based on 11.3% sales growth, a 10 basis point dip in gross margin, and 20 basis points of operating expense leverage.
BofA also notes that comparable sales excluding gasoline improved to 7.2% in Q4 from 6.8% in Q3, a sequential acceleration that would be bullish context. But the gross margin piece is where the risk concentrates. In Q3, gross margins compressed roughly 21 basis points year-over-year, offset by SG&A leverage and a surge in high-margin membership fees, as Costco leaned into price investments to drive volume. If that margin compression widens in Q4 while gas tailwinds fade, the EPS beat becomes harder to manufacture.
The Consumer Backdrop Cuts Both Ways
August retail sales jumped 1.2% after a 0.5% drop the prior month, though the data is not adjusted for inflation and gas station sales surged 3.1%, accounting for some of the headline strength. Excluding gas stations, retail sales still rose 1.1%, reflecting notably broad spending.
For Costco specifically, that gas dynamic is a double-edged sword: record fuel volumes in Q3 inflated the unadjusted comp, and any deceleration in Q4 will make the headline number look softer regardless of underlying merchandise trends.
Oppenheimer’s Rupesh Parikh sees the possibility of a core earnings miss, while RBC Capital’s Steven Shemesh flagged rising fuel and transportation costs as margin pressure. Shemesh does, however, believe that tariff relief could help offset that pressure.
Historical Context for the Options Premium
The implied move is not irrational in isolation. On May 28, options implied a 3% move but shares fell 11%. On March 5, a 3% implied move preceded a 0.3% actual change. On December 11, the stock dropped 4.1% against a 3.2% implied move, and on September 25, 2025, shares declined 4.9% against a 3.5% implied move. The options market has been wrong in both directions, and frequently underestimated the actual move. That asymmetry matters for anyone selling premium into Thursday.
Q3 EPS of $4.93 came in slightly below the $4.98 consensus, and the stock fell nearly 5% on the day. That is what a near-50x multiple does when something goes sideways, even slightly.
Options Market Analysis
The September 24 straddle prices in a $31.60 move in either direction. For the bull side to clear the implied move, COST needs to close above roughly $925. For the bear side, a close below $860. Two metrics have repeatedly moved the stock more than the headline revenue beat or miss: the membership renewal rate and comparable sales. As of Q3, the U.S. and Canada renewal rate stood at 92.2%, with the worldwide rate at 89.7%. Any deterioration in renewal rates would be a significant negative catalyst given how much of the bull thesis rests on that recurring fee stream.
COST shares are only up about 3.8% year-to-date, against a market that has run materially higher, leaving the stock in a range where sentiment is fragile but valuation has compressed slightly from its 2026 peak.
Structured Trade Framework
Bull case: If you believe comparable sales ex-gas hold at 7%+ and membership fee income grows north of 10%, a defined-risk long call spread targeting the $920–$940 range captures upside without full exposure to IV crush. The risk is paying elevated premium for a stock that has historically moved less than priced.
Bear case: For traders expecting margin deterioration and a guidance signal around supply chain costs, a put spread centered around $870–$850 offers defined risk exposure to the downside. The historical pattern of actual moves exceeding implied moves supports keeping the spread wide.
Neutral case: Given the 3.53% implied move against a 1.42% historical average, an iron condor collecting premium on both wings is structurally attractive. The risk is the repeat of May 28, when the stock moved 11% and obliterated short-vol positions.
Action Checklist
- Watch adjusted comparable sales (ex-gas, ex-FX): consensus expects approximately 6.6–7.2% growth. Below 6% is a miss that matters.
- Track gross margin commentary. A second consecutive quarter of roughly 20-basis-point compression without SG&A offset will pressure EPS expectations.
- Membership renewal rate: any move below 92% in the U.S./Canada is a bearish signal the market will price immediately.
- Membership fee income growth: Q3 came in at 10.7%. A deceleration toward 8% or below suggests the September 2024 fee increase tailwind is largely exhausted.
- Manage defined-risk structures before the close on September 24. IV crush post-earnings will be severe regardless of direction.