

There’s a market signal that shows up around 9:35 AM that most traders completely overlook.
They’re watching RSI.
Moving averages.
Candlesticks.
Trying to figure out where the market is headed next.
Meanwhile, I’m watching what happens in the first few minutes after the opening bell.
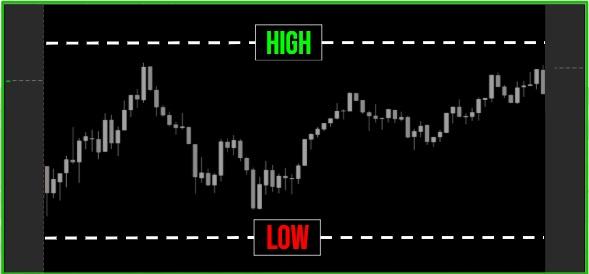
Because that’s where I’ve found a recurring pattern that can help identify key levels above and below the market.
I’ve spent years tracking this behavior.
And over the past two years, we’ve seen this approach produce 618 winning signals.
Now there’s a new test on the table.
Can we get to win #618 before the weekend?
I’ve set a challenge in motion to find out.
No trading guarantees, of course…
But I can show you the data behind the setup, the levels I’m watching, and exactly what I’m looking for as we make our run from #618 toward #620.
If you want to follow along the Challenge, I’ve laid everything out right here.
See you in the market,
Chris Pulver
Klarna Reports Tuesday. Options Price a 13% Swing, Stock Down 63%

Markets do not need a miss to punish Klarna. They proved that in August. The company posted a Q2 EPS of $0.01, beat the consensus by $0.07, and the stock still fell roughly 22% on the day after management slashed its full-year GMV outlook to $149–$151 billion from a prior target above $155 billion, citing Germany weakness and softer discretionary spending in Europe. The lesson going into Tuesday is blunt: the number matters less than the guide.
Klarna will publish Q3 2026 earnings before the U.S. market opens on Tuesday, November 17, with a webcast at 8:30 a.m. ET. Options data compiled by Bloomberg puts the implied move at 13%, directionally consistent with what the market priced before each of the last three reports, and in every one of those cases the stock moved more than options anticipated, always to the downside. On February 19, options implied 12.7% but the stock fell 27.5%; in November 2025, the implied move was 12.9% while shares declined 13.8%. This is not a bullish track record for volatility sellers.
What the Numbers Say
Consensus EPS for Q3 stands at -$0.15, against a loss of -$0.25 in the same quarter last year. Analysts expect revenue of $963.88 million, up from $903 million a year ago. Guidance at the Q2 report targeted Q3 GMV of $35–$36 billion and revenue of $940–$980 million. The street is essentially expecting Klarna to land at the top of its own range. Any shortfall there reopens the guidance credibility argument that torpedoed August’s session.
Klarna’s Q2 progression was real: GMV hit $36.6 billion, revenue $1.042 billion, transaction margin dollars $446 million, and adjusted operating income $91 million, all growing year-over-year. Credit quality also continued to improve, with provisions as a share of GMV declining sequentially. The bear case on Tuesday is not the credit book itself, it is the macro ceiling above it.
The Macro Ceiling
Total U.S. household debt expanded $334 billion in Q3 2026 to $19.1 trillion, while aggregate delinquency rates worsened to 5.0% of outstanding debt in some stage of delinquency, up 0.3 percentage points from the prior quarter. For a business that underwrites every transaction individually, that trend line matters. BNPL sits at the front of consumer spending decisions, which means Klarna is an early-warning system for household stress, and right now the system is blinking. Affirm (AFRM), PayPal (PYPL), SoFi (SOFI), and Synchrony (SYF) all carry versions of this same read-through.
The delinquency trend is not isolated to BNPL. SoFi’s Q3 results framed the same household stress as a binary event for a lending book built at lower rates.
Options Structure and Defined-Risk Frameworks
At roughly $13.80 heading into the weekend, a 13% implied move puts the expected range at approximately $12.00 to $15.60 by Friday’s close. The 52-week low sits at $12.06, meaning the lower bound of the expected move essentially rests on structural support. That is not coincidence, it reflects where put protection is concentrated.
IV heading into this report is elevated relative to Klarna’s post-IPO history, consistent with a name that has beaten implied moves to the downside three times running. Put/call flow this week has leaned directional rather than strangle-based, suggesting the market is not treating this as a symmetric event.
For traders expecting continued downside: a defined-risk structure such as a long put spread targeting the $12.00–$13.00 range, using the November 21 expiry, limits premium exposure while positioning for a retest of the 52-week low if guidance disappoints again. If you believe the new CFO announcement and pre-earnings stock strength signal a credibility reset, a bull call spread in the $14.00–$16.00 range keeps risk fixed while capturing a move toward the pre-earnings close of $19.51 on August 17. A neutral short strangle is structurally exposed here, three consecutive realized moves outside implied range make premium selling a low-probability posture.
Risk Analysis and Forward Outlook
The asymmetry is straightforward. A beat on EPS with flat or improved guidance removes the August overhang and could lift KLAR toward the $16–$18 range where TD Cowen and Loop Capital hold targets. A second consecutive guidance cut likely sends the stock back toward the $12.06 floor. Shares have already fallen 60.1% over the past 12 months, compressing the multiple but not eliminating downside risk in a deteriorating consumer environment.
October retail sales, Walmart, Target, and Home Depot all report the same week, giving Tuesday’s Klarna report an immediate sector context check. If retail data weakens alongside any softness in Klarna’s GMV commentary, the pressure compounds fast across AFRM and PYPL.
Action Checklist
- Confirm position size against a 13% single-session move scenario, both directions.
- Identify your thesis pivot: if the trade depends on guidance language rather than headline EPS, set that trigger before the 8:30 a.m. ET webcast.
- Monitor AFRM, PYPL, and SYF for correlated sector flow on Tuesday morning.
- Use defined-risk structures only. Naked short options on KLAR earnings have been structurally punished at each of the last three reports.
- Watch GMV guidance range versus the $149–$151 billion full-year number cut in August, any further reduction resets the multiple discussion.
This is analysis, not investment advice. All options involve risk of total loss of premium. Past implied move accuracy is not predictive of future results.