August 4, 2026
Friday’s Jobs Report Is a Rate-Hike Vote
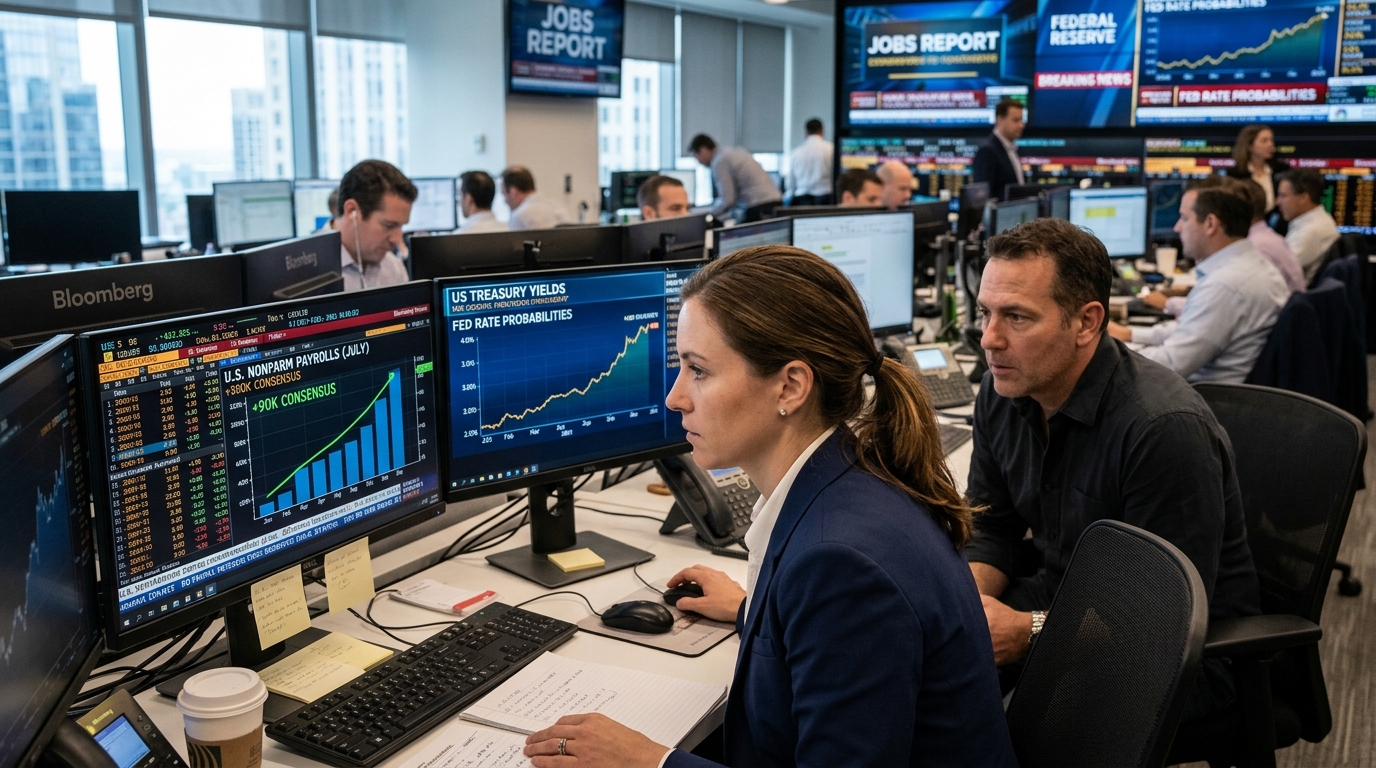
Consensus expects about +90K for July. A beat may push September hike odds higher.
First a note from Stocks To Trade
You’ve probably felt this before.
Nvidia runs. Everyone online is suddenly a genius.
You watch the chart, tell yourself you missed it, and move on with your day.
Here’s what most people never find out.
The Russell 2000 just posted its best first half since 1991, up nearly 22%.
Three small semiconductor stocks riding that same AI wave gained more than 400% each this year.
None of them were Nvidia. None of them were anywhere near the headlines.
The checklist for finding stocks like this comes from Tim Sykes, a trader with more than 25 years in the market.
He turned $12,415 in bar mitzvah money into $1.65 million while he was still in college.
Since then he’s mentored more than 50 students to a million dollars in trading profits.
He put the whole process on video, free to watch.
Friday’s Jobs Report Is a Rate-Hike Vote
The most important number in markets right now is not a revenue line, an EPS beat, or a guidance revision. It is a single government release at 8:30 a.m. ET on Friday: the Bureau of Labor Statistics’ July Employment Situation report. Consensus sits around +90,000 nonfarm payrolls, up from the 57,000 added in June, a number that came in well below the roughly 115,000 consensus economists expected and triggered one of the sharpest single-session shifts in Fed rate-cut odds in 2026.
That was then. The macro environment has moved considerably since July 2. This week’s ISM Manufacturing PMI came in at 55.6, the strongest reading since May 2022, with factory employment returning to expansion territory. Bond vol has cracked higher. The VIXTLT Index moved from the 16th to the 68th IV percentile in the span of one week. And prediction markets are now pricing a roughly 55% probability of a 25-basis-point rate hike at the September 16 FOMC meeting, with a non-trivial chance of a 50-basis-point move on top of that. Friday’s payroll number will either validate or dismantle every one of those bets before the market opens for business.
This is not a conventional earnings-catalyst trade. It is a policy repricing event. And the instruments that move fastest, farthest, and most predictably are not the ones most retail options traders are watching.
What the Data Says Now
Start with what the leading indicators are telling you. The ISM Manufacturing PMI employment sub-index rose to 52.8 in July from 49.7 in June, crossing back above 50 for the first time since early 2025. Manufacturers expanded hiring, linking continued demand strength to improving labor market conditions. That is a first-order signal for Friday’s manufacturing payrolls component.
Separately, the S&P Global US Manufacturing PMI confirmed the expansion for July, with factory employment posting a renewed increase. Supply chain disruptions remained severe, with supplier delivery times deteriorating at one of the fastest rates in four years. That sounds bearish on the surface. For employment, it is the opposite: it means factories are running lean, inventories are depleted, and firms need bodies to keep production moving.
America’s Oil Safety Net Is Running Low. What’s Your Reserve?
The U.S. Strategic Petroleum Reserve sits near its lowest level since 1983. The nation’s emergency stockpile can be drained, but gold cannot be printed or drained. That is why many retirees are learning how a Gold IRA generally works, and how they may move a portion of an IRA, 401(k), TSP, or 403(b) into physical metals. Start with the FREE guide from America’s Gold Company.
Request your FREE Precious Metals Retirement Guide from America’s Gold Company today.
The June miss had a clear mechanism: professional and business services led all gains at just 36,000, while social assistance added 25,000 and healthcare added 22,000. The manufacturing sector was effectively flat. A stronger ISM employment index in July implies that channel is now contributing, not subtracting. The question is by how much.
For the Fed, context matters as much as the headline. June CPI ran at 3.5% year-over-year. The FOMC held rates at the 3.50% to 3.75% target range at its July 29 meeting on a 9-3 vote, with three members dissenting in favor of an immediate hike. The 30-year Treasury yield has pushed to around 5.2% in recent months, its highest level since 2007. Initial jobless claims dropped to 187,000 in the week ended July 18. The labor market, by every concurrent measure, is not breaking. A payroll beat on Friday does not just surprise markets. It gives the three FOMC dissenters the data they need to pull more members across.
The September Stakes
Here is the reframe that most options traders are missing: this payroll report is functioning as a Federal Reserve pre-commitment device, not a standalone macro data point. Chair Kevin Warsh has signaled a willingness to act without extended forward guidance. A payroll beat in the range of 130,000 or above, combined with wage growth holding at 0.3% month-over-month, would make a September hold politically tenuous given the three public dissents already on the record.
A weak number, closer to 57,000 or below with a rising unemployment rate, would do the opposite: strengthen the case for holding through year-end and likely push the dollar lower, rally long bonds, and compress the recent premium embedded in rate-sensitive equity sectors.
The asymmetry of those two paths is not equally sized. The equity market has been absorbing hawkish signals with unusual resilience. The S&P 500 is up roughly 13% year-to-date. The VIX closed just under 16 heading into this week despite violent intraday reversals. That compression in headline equity vol, while TLT put skew has been elevated, is telling a specific story: the bond market is already pricing the hike. Equities are not.
Sector Implications
Rate-sensitive sectors carry the most direct exposure. Utilities and REITs, which have underperformed year-to-date as the 10-year moved above roughly 4.7%, face continued pressure if Friday’s number adds conviction to September hawkishness. Financials, particularly regional banks, benefit from steeper net interest margins in a higher-for-longer scenario. Industrials present a split picture: the ISM beat is constructive for the business cycle, but higher rates compress the multiple on any long-cycle capital goods company.
The currency channel matters here too. A strong payroll print likely extends the dollar’s recent strength, which is already pressuring multinationals reporting in non-dollar revenue streams. Energy is a separate story. Oil is a meaningful input to the inflation picture, and the Iran risk premium has not disappeared. A labor market that refuses to crack gives the Fed room to keep rates elevated, which in theory should strengthen the dollar and cap crude. In practice, supply disruption risk and geopolitical uncertainty mean oil does not simply obey the dollar correlation in 2026 the way it did in prior cycles.
The Playbook Every Options Trader Should Have!
Do you dream of retirement but it seems like an impossibility? Wish you knew the best moves to get you there sooner?
It’s closer than you think and you won’t have to work overtime to get it!
Hi! I’m Dave Aquino, expert options trader and my e-book, “How To Master the Retirement Trade” has helped thousands reach their goals!
Follow the link to get your copy and see what you’ve been missing!
Options Market Analysis
SPY IV rank: approximately 12. That is a historically low reading entering a macro event of this magnitude. The VIX closing near 15-16 as the NFP approaches represents a market that has dramatically underpriced the policy volatility embedded in a two-sided jobs number. Short-dated implied volatility on Tuesday was already trading sub-40 basis points in SPX straddle terms, with Friday straddles only slightly elevated despite the week’s most consequential event landing at the end of it.
The divergence to watch is between equity vol and bond vol. The VIXTLT Index moved from the 16th to the 68th IV percentile in the past week. Demand for TLT puts surged, driving TLT 1-month skew to an extreme. That is not a coincidence. Bond market participants are pricing Friday as a rate-hike catalyst. Equity market participants, judging by VIX alone, are not. That gap is the opportunity.
TLT is trading in the mid-$80s, with the put/call open interest ratio elevated and institutional positioning heavily skewed toward further yield increases. The 30-year yield is already near its highest level since 2007. A hot payroll print does not have to produce a dramatic TLT move to generate alpha in a defined-risk structure; even a 1-2 point move in a roughly $84 ETF, properly leveraged via options, produces a multiple of the premium risk.
For SPY, the calculus is more nuanced. The index has been making fresh all-time highs. A strong jobs number could paradoxically weigh on equities by hardening September hike expectations, flipping the usual “strong economy equals higher stocks” reflex. A weak number, in the current environment where the market has priced in moderate growth, could rally the S&P by removing the hike threat entirely. Either way, buying a straddle into a 12 IV-rank environment ahead of a binary macro event is structurally attractive on a risk-adjusted basis, the premium is cheap relative to the event size historically embedded in NFP surprises.
Structured Trade Framework
Bull Case (Strong Jobs, Curve Steepens, Financials Lead)
If July payrolls come in at 130,000 or above, with average hourly earnings holding at +0.3% month-over-month, the September hike probability moves above 70%. The dollar strengthens. Short-duration bonds sell off. Financials outperform on net interest margin expansion expectations.
For traders expecting this outcome, a defined-risk structure would be a KRE (Regional Bank ETF) bull call spread, buying the August 15 expiry call at the money and selling the call 3% to 5% out of the money. IV rank on KRE is elevated relative to SPY given the rate sensitivity embedded in that sector. The spread captures the directional move while defining maximum risk to the premium paid.
Alternatively, a TLT bear put spread, buying the near-the-money August 15 put and selling the put 3 points lower, captures the yield spike mechanically. At current pricing, this structure can cost roughly $0.80 to $1.00 in premium for a $3.00 maximum payout, a favorable risk/reward given the bond market is already leaning into the hike thesis.
Bear Case (Weak Jobs, Hike Off, Tech Rallies)
If July payrolls print at 57,000 or below, matching or missing June’s already-weak number, the September hike probability collapses. Rate-sensitive growth stocks (technology, discretionary) benefit. TLT likely rallies 1.5 to 3 points as yields retrace. The dollar pulls back, which helps large-cap multinationals with overseas revenue.
For traders expecting this outcome, a QQQ bull call spread dated to August 15 captures the tech rally in a defined-risk format. The QQQ has lagged the broader S&P during the recent earnings period; if the hike thesis comes off, the Nasdaq catches up. Buying the August 15 at-the-money call and selling the call 4% above captures the directional move while capping downside to the spread premium.
Neutral Case (In-Line Print, Vol Crush, Theta Wins)
If July payrolls land in the 80,000 to 100,000 range with no significant surprise in wages or unemployment, the market’s dominant reaction will be a vol crush. The VIX near 15 implies a compressed straddle that deflates after the number regardless of direction if the move is modest. Friday-dated straddles are priced for a larger swing than a consensus print would produce.
For traders who believe the number comes in roughly as expected, selling an iron condor on SPY dated to Friday’s expiration, selling the at-the-money straddle and buying wings 1.5% to 2% out on each side, captures the premium contraction while defining risk to the spread width. This is a theta trade, not a directional bet. The maximum risk is the wing spread width minus the premium collected. The maximum gain is the full premium if SPY closes between the short strikes.
Risk Analysis
The primary risk to every structure above is revision volatility. The June number came in at 57,000 against a roughly 115,000 forecast. But the prior month, May, was simultaneously revised down. Large revisions in either direction can whipsaw the initial reaction before the market settles on the true signal. Structures with longer duration (August 15 expiry versus this Friday) insulate against the knee-jerk reversal that sometimes follows a big revision discovery.
The secondary risk is geopolitical overlay. The Iran conflict has introduced oil price volatility that operates on a separate timeline from the labor market. A spike in crude on Friday morning, regardless of the jobs number, could muddy the immediate rate-policy read and create a cross-asset noise trade that obscures the true directional move. Keep position sizing modest relative to account size going into a morning where two independent catalysts can move simultaneously in conflicting directions.
The third risk is the Warsh factor. The current Fed chair has explicitly signaled a departure from traditional forward guidance. That means the market’s conditional probabilities, “if payrolls beat, hike probability rises to X”, are less reliable anchors than they were under prior chairs. A strong number is necessary but may not be sufficient for a September move if Warsh decides to use the meeting to reassess the full inflation trajectory rather than react to a single month of labor data.
Forward Outlook
Regardless of Friday’s print, the structural trade in bond volatility is not resolved in a single session. The VIXTLT Index at the 68th percentile reflects a market that is genuinely uncertain about the terminal rate. If September arrives as a live meeting, the August CPI reading, due September 10, becomes the next critical event. That reading, layered on top of Friday’s payroll data, will set the final tone before the FOMC convenes on September 16.
The calendar from here through mid-September is essentially one continuous policy data stream: Friday’s NFP, next Wednesday’s ADP and ISM Services, August CPI on September 10, and the FOMC decision six days later. Traders who treat each of these as discrete, isolated events will be constantly repositioning. The better approach is to structure positions that remain exposed to the dominant macro theme, elevated inflation, hawkish dissent, labor market resilience, across multiple expirations rather than concentrating in single-session binary bets.
The bond market has already voted. TLT is down more than 40% from its all-time high. The 30-year yield is at levels not seen since the financial crisis era. If Friday’s payroll data confirms what Monday’s ISM employment sub-index strongly implied, the equity market will have to confront a September hike that it has priced as a distant possibility rather than the base case. That repricing, when it comes, will not be gradual.
Action Checklist
- Verify the consensus baseline: current Street expectations are roughly +90,000 payrolls with unemployment steady near 4.2% and wages at +0.3% month-over-month. A print above 130,000 is a hawkish shock. A print below 60,000 is a dovish shock.
- Monitor TLT IV vs. SPY IV divergence: VIXTLT at the 68th percentile while SPY IV rank sits near 12 is the core anomaly. Bond vol is already elevated. Equity vol is not. Any convergence, equity vol catching up, benefits long-vol structures on SPY.
- Track the wages sub-component: headline payrolls move markets first, but average hourly earnings drive the Fed’s inflation calculus. A strong headline paired with hot wages (+0.4% or above) is the highest-severity hawkish outcome.
- Size for revision risk: use August 15 expiry rather than this Friday on directional structures to absorb the revision noise that routinely accompanies the initial BLS release.
- Defined-risk only: in a 12 IV-rank environment with a binary macro catalyst, naked short-vol is not the appropriate expression. Spreads with capped downside allow participation in the vol event without exposure to a tail move in either direction.
- Watch the September Fed meeting date: September 16 is the fulcrum. Every piece of data between now and then, starting Friday, is a vote on whether Warsh moves. Position accordingly, not just for Friday morning, but for the six weeks ahead.