

November 4, 2026
Bonus Content: Figma Reports Tonight With Its Stock Down 80% From Its IPO Peak
Right now, robots run the market.
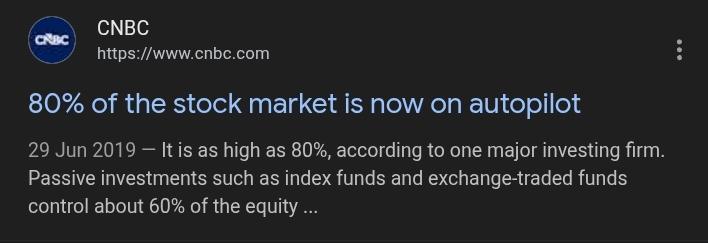
As of 2019, 80% of all stock trading was done by high-efficiency algorithms and bots. That number has since increased.
Wall Street is already letting unemotional, ruthless robots do their dirty work.
So why should you and I be left behind?
This is exactly why I developed K.I.R.A..
The advanced AI engine is designed to outclass any other tool you’ll find out there.
It goes without saying, of course, that K.I.R.A. won’t execute trades on your behalf.
However, it will hand you every single detail you need to help you take the trade yourself.
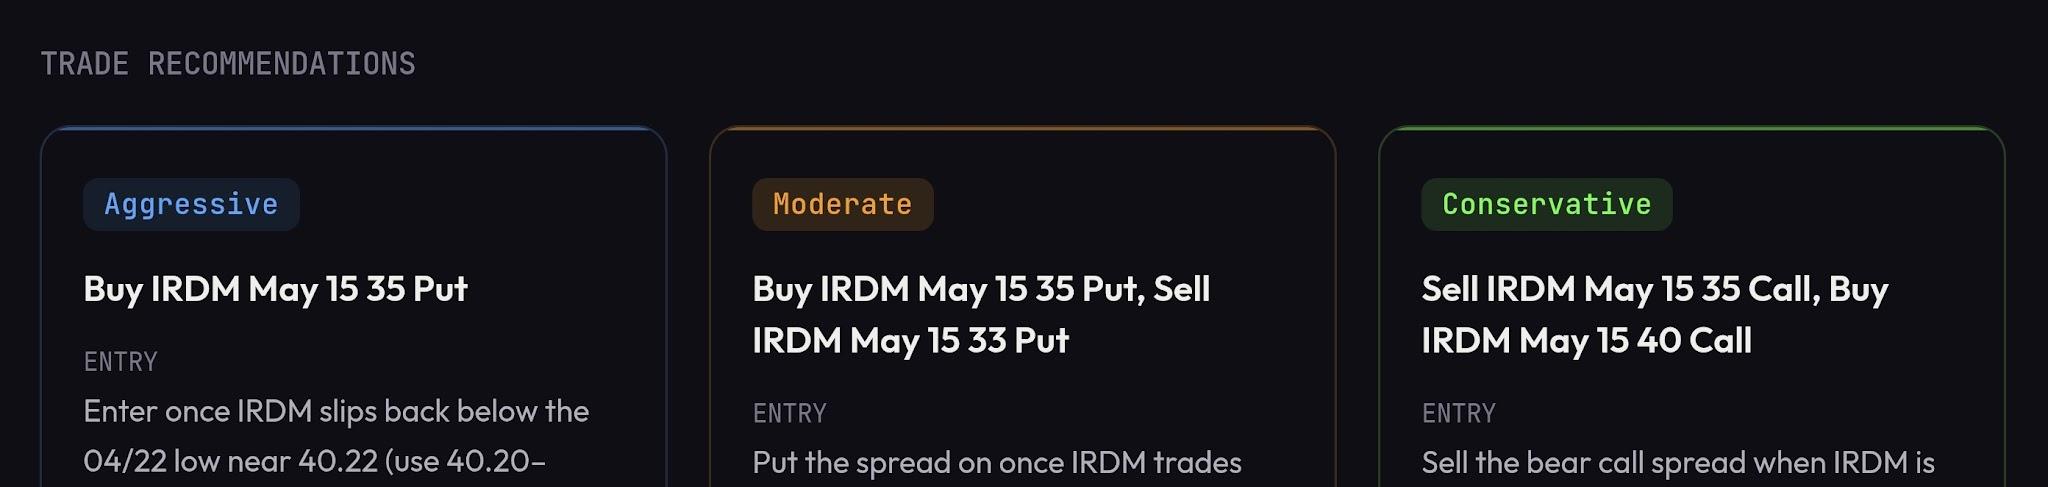
In fact, it isolates three different approaches to the same trade for you to choose from based on how much risk you’re willing to take on.
Now you don’t have to take my word for it.
You can fire K.I.R.A. up right now and see everything for yourself.
Till the next trade,
Lance Ippolito
Figma Reports Tonight With Its Stock Down 80% From Its IPO Peak

Markets don’t reward revenue growth. They reward revenue growth relative to what was already priced in. Figma enters tonight’s Q3 earnings call with two straight quarters of beats in hand and a stock that has still lost roughly 80% of its value from its first-day close. That gap between execution and perception is the central tension every trader needs to understand before sizing a position.
Figma priced its IPO at $33 a share in July 2025, opened at $85, and closed its first day near $115.50, valuing the company at about $68 billion. The stock now trades near $21, with a market cap of approximately $11.2 billion. That is not a correction. That is a reset of the entire growth story.
The Numbers on the Table
For Q3 2026, the revenue consensus sits at $376.53 million, with EPS anticipated at $0.05. The company’s own guidance calls for $373 million to $375 million in revenue, which would mark roughly 36% growth from the $274.2 million it posted a year earlier. That guidance range is notably tight, suggesting management has visibility. The question is whether Wall Street believes it.
Figma has beaten revenue estimates in each of its four prior quarterly reports: Q3 2025 by 3.88%, Q4 2025 by 3.63%, Q1 2026 by 5.51%, and Q2 2026 by 5.27%. On the bottom line, the beat rate is even more pronounced. EPS surprised to the upside by 119.51% in Q3 2025 and by 94.97% in Q2 2026. A company that consistently clears the bar by double digits on earnings is not an execution problem. It is a valuation and competitive fear problem.
What the Market Is Actually Worried About
At Canva Create in April 2026, Canva introduced Canva AI 2.0 as a shift from a design platform with AI tools to an AI platform with design tools. Canva positioned the update as part of a broader push into AI-assisted creation and editing, stepping more directly into the same “start-to-finish” workflow space that Adobe and Figma have historically dominated. That pivot reframed the competitive landscape from feature comparison to existential positioning.
When Figma reported Q2, the stock sank about 14.8% after hours despite beating estimates, as Q3 guidance of $373 to $375 million implied a slower 36% growth rate. This is the pattern: beat the number, lose on the guide. Tonight carries the same risk. Reuters reported October 15 that Figma’s CFO said the platform was willing to put margins on the line to boost AI demand. That is a candid admission that AI investment is compressing the path to profitability, which is exactly what a loss-making stock cannot afford to signal into a skeptical market.
Options Market Analysis
Current implied volatility and IV rank/percentile vary by data vendor and calculation method, but directional reads still matter: implied volatility is elevated into the event, and the market is pricing a double-digit post-earnings move. The key point is not the decimal precision. It is whether you are being paid enough to wear gap risk overnight.
Options markets are pricing an expected move of roughly 13% in either direction when the company reports after the close on November 4. That is approximately $2.70 on a $21 stock. History warrants respect for that number. On May 14, shares rose about 18.8% against an implied move near 13%. On September 3, 2025, shares fell more than 20% after the report, a reminder that FIG can break implied ranges sharply in both directions.
Put/call ratios and open interest also vary by venue and timestamp, but the qualitative takeaway is consistent: positioning skews call-heavy in open interest, while pockets of put demand have shown up as hedges into catalysts. Earlier in October, options flow turned notably bearish around near-the-money puts, a sign that some holders were paying up to protect downside heading into this report.
Structured Trade Framework
Bull case: If you believe Figma delivers a 5%-plus revenue beat consistent with prior quarters and raises full-year guidance, a defined-risk debit call spread in the November expiry, targeting a move toward $25 to $26, keeps loss bounded to premium paid. The 13% implied move puts that level within one standard deviation.
Bear case: For traders expecting a repeat of the August pattern, where a beat was met with a sell-off on guidance deceleration, a put spread below $19 offers defined risk on a move through the 52-week low at $16.60. The wide distance between current price and that floor demands disciplined sizing.
Neutral case: With IV not extreme versus its own history, a short strangle is not structurally attractive. A defined-risk iron condor centered on the current $21 price with wings outside the 13% expected move provides premium collection if the stock stays within its implied range, which has occurred in three of Figma’s last five earnings releases.
Risk Analysis and Forward Outlook
Figma carries the classic profile of a speculative growth company: strong revenue expansion paired with persistent losses. Trailing-twelve-month EPS stands near negative $3.06, making traditional earnings multiples meaningless for valuation. At roughly 8 to 9 times trailing sales on an $11 billion market cap, the stock prices in continued 35%-plus growth with no near-term margin recovery.
The forward question is whether Figma’s AI credit monetization, flagged by Piper Sandler as a growth driver in late October, can widen the moat against Canva’s roughly 260 million monthly users. Figma’s product stickiness is real, but “adoption rate” and “switch rate” statistics vary widely depending on the dataset and definition. Whether that stickiness commands a growth premium while the company burns cash is tonight’s question.
Action Checklist
- Confirm position sizing before 4:00 PM ET; the report is scheduled after the close.
- 13% implied move on a $21 stock equals roughly $2.70 up or down. Define risk accordingly.
- Watch Q4 guidance against the current $376M+ consensus. That number, not Q3 results, will set direction.
- Monitor AI cost commentary. Any language about margin investment accelerating is likely to pressure shares regardless of the revenue beat.
- A defined-risk structure on either side is mandatory here. FIG has exceeded implied moves by multiple percentage points in a single session before.