
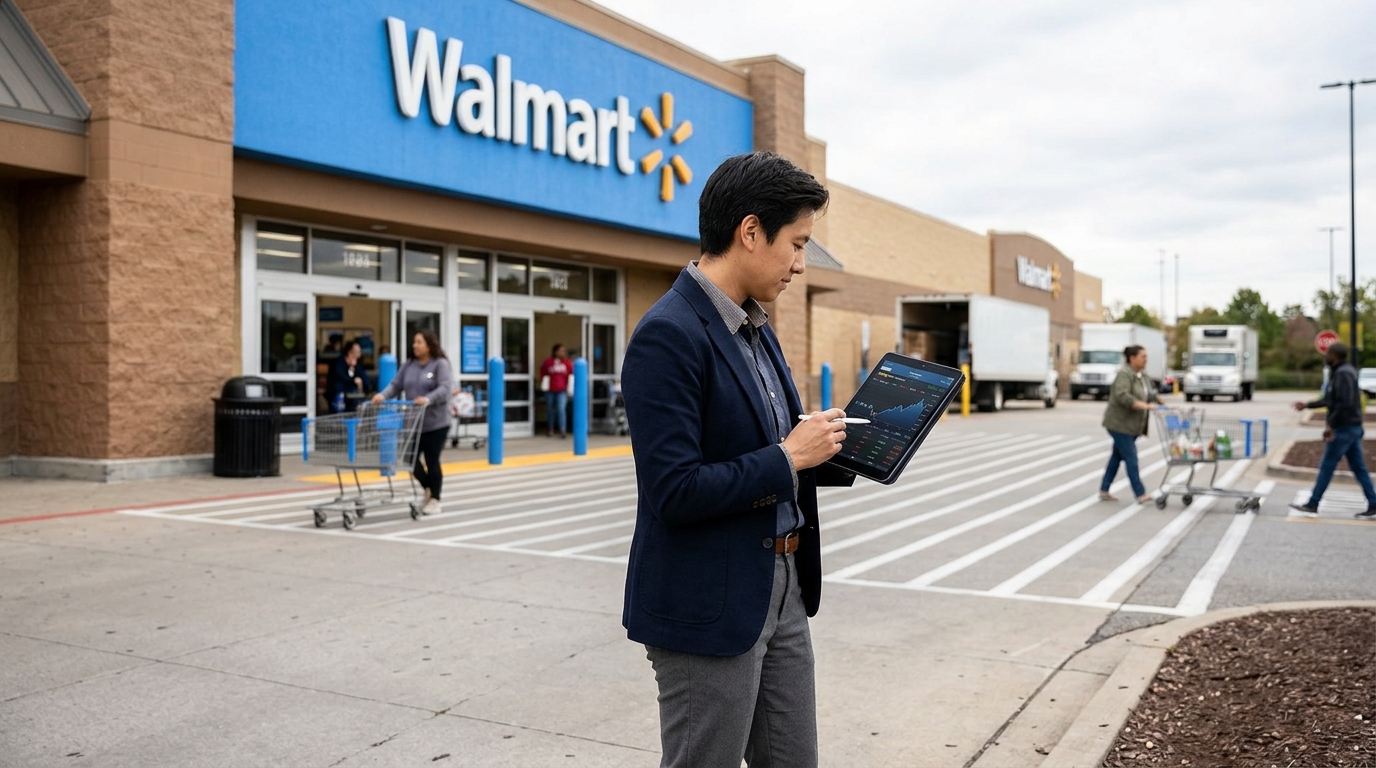
Walmart reports fiscal Q3 results this morning before the open, with the earnings call at 8am ET. Visible Alpha consensus puts Q3 FY2027 revenue at $187.3 billion, up 4.3% year-over-year. Diluted adjusted EPS is estimated at $0.64, with the consensus range running from $0.61 to $0.66, marking a 2.6% increase from the year-ago quarter. Both figures land at the top of management’s own guidance: the company guided Q3 adjusted EPS of $0.62 to $0.64.
This is not simply another retail report. It is the final, largest read on the American consumer in a week that has already processed Home Depot, Target, Lowe’s, and TJX. October retail sales rose 0.2% in nominal terms, about flat after inflation. Strong October retail sales pushed market odds for a December Fed rate hike to around the mid-90% range.
What the Numbers Need to Show
Consensus comparable sales growth sits at roughly 3.2%, or about 2.9% excluding fuel, with gross margin projected near 24.4%, flat from a year ago. Walmart’s advertising business is expected to grow 25% year-over-year to $1.98 billion in Q3, while membership and other income rises an estimated 8.2% to $1.87 billion. Those two lines now matter beyond their dollar contribution: they signal whether the higher-margin business mix is actually taking hold.
Walmart expects full-year FY2027 adjusted EPS of $2.80 to $2.87 and adjusted operating income growth of 7.0% to 8.5%. Any Q4 guidance that holds that range is likely viewed as constructive. Any guidance that trims the floor, as happened earlier in calendar 2026, reopens the downside quickly.
Why the Options Premium Matters More Than the Direction
Here is the specific problem for buyers of volatility today. As of November 16, WMT traded near $128.41, with November 20 at-the-money options pricing approximately $8.15 of movement, or 6.3%. Thirty-day at-the-money implied volatility sat near 34%, compared with approximately 24% realized volatility over the preceding 30 trading sessions. That is a 10-point IV premium over recent realized vol. The options-priced move of 6.3% to 6.6% exceeds Walmart’s average historical post-earnings move of about 4.8%.
The historical record is blunt about what usually happens. The stock has often moved less than the implied range around earnings, though there have been meaningful exceptions when guidance changed sharply. Near-dated implied volatility is substantially higher than longer-dated volatility, creating direct exposure to post-earnings volatility compression. Buyers of outright calls or puts need a sufficiently large directional move to overcome both the premium paid and the expected decline in implied volatility.
Options Structure and Positioning
Positioning in the options market has tilted toward calls, while implied volatility is elevated into the report. That call skew reflects bullish positioning but also creates asymmetric risk: a guidance miss can hit a crowded long-vol, long-direction trade simultaneously.
Three structured frameworks apply here:
- Bull case (defined risk): If you believe Walmart delivers an in-line quarter or beats and raises Q4 guidance, a bull put spread below the current implied range captures elevated premium while keeping loss fixed. The $120/$115 weekly spread collects credit while staying outside the 6.3% downside band. Maximum loss is the spread width minus premium received.
- Bear case (defined risk): The stock sold off sharply after the last two reports, including about a 9.15% one-session drop on August 20, 2026, and a roughly 7% one-session decline on May 21, 2026. For traders expecting a guidance reduction, a put spread within the implied range, such as the $125/$120 structure, buys directional exposure while offsetting some of the IV premium paid.
- Neutral (premium capture): Because near-dated IV sits substantially above longer-dated vol, an iron condor spanning beyond the implied move sells the premium on both wings. A short $120 put / long $115 put paired with a short $136 call / long $141 call keeps both short strikes outside the 6.3% implied range. The position profits from vol compression if Walmart lands inside the band, which it has often done across recent reports.
Risk Analysis
Walmart enters the report with guidance, consensus, and positioning closely aligned, so the surprise will come from comparable sales, margin detail, and the Q4 outlook. Analysts have flagged margin conversion and sustained digital profitability as key swing factors for the stock. A comp sales miss or any sign that tariff and freight costs are compressing Q4 operating income would be the catalyst that breaks the pattern and justifies the elevated implied move.
The comp-sales and margin detail Walmart prints will land inside a broader consumer bifurcation that has been widening all year. Upper-income and lower-income spending are diverging sharply, and Walmart’s traffic mix sits at the exact fault line between those two realities.
Forward Outlook
Q3 growth is expected to be led by Walmart International and Sam’s Club, though the domestic business remains the largest contributor to group sales. Management has flagged a headwind of over 100 basis points to Q3 growth related to a timing shift of Flipkart’s Big Billion Days between Q3 and Q4, which may cause the market to look through a headline comp miss if CFO John David Rainey frames Q2 and Q3 together. The Fed’s December decision three weeks out means Walmart’s consumer commentary carries macro weight beyond the stock itself.
Checklist
- Consensus: $187.3B revenue, $0.64 adjusted EPS; company Q3 guidance was $0.62 to $0.64
- Key watch: U.S. comp sales vs. 3.2% consensus; gross margin vs. 24.4% estimate; Q4 EPS guidance vs. the $2.80 to $2.87 full-year range
- IV context: 30-day ATM IV near 34% vs. 24% realized; implied move 6.3%, historical average 4.8%
- Options positioning: call activity has been elevated into the event; implied volatility is high versus recent history
- Defined-risk bull structure: bull put spread below $120 weekly; bear structure: put spread $125/$120; neutral: iron condor outside the 6.3% implied band
- Primary risk: guidance reduction on Q4 operating income, as seen in the May and August 2026 reactions